Disclaimer All information is offered in good faith and in the hope that it may be of use for educational purpose and for Database community purpose, but is not guaranteed to be correct, up to date or suitable for any particular purpose. db.geeksinsight.com accepts no liability in respect of this information or its use.
This site is independent of and does not represent Oracle Corporation in any way. Oracle does not officially sponsor, approve, or endorse this site or its content and if notify any such I am happy to remove.
Product and company names mentioned in this website may be the trademarks of their respective owners and published here for informational purpose only.
This is my personal blog. The views expressed on these pages are mine and learnt from other blogs and bloggers and to enhance and support the DBA community and this web blog does not represent the thoughts, intentions, plans or strategies of my current employer nor the Oracle and its affiliates or any other companies. And this website does not offer or take profit for providing these content and this is purely non-profit and for educational purpose only.
If you see any issues with Content and copy write issues, I am happy to remove if you notify me.
Contact Geek DBA Team, via geeksinsights@gmail.com
|
As we all know, optimizer parse the statement to provide a plan, but to provide that Oracle Optimizer has to go through different phases called Parse, Execute, Fetch.
1. Parsing has three phases again,
Compiler: Compiles the statement to oracle readable format or oracle understandable state.
Estimator: Look out the statement and get the object names and check the object statistics and provide a estimate how much time and resources like cpu / mem / io required to execute this plan
Plan Generator: Based on the estimator inputs, plan generator will provide the plan in terms of execution plan.
Then plan execution will be done by the server process and get the data out from disk or buffer with two different phases called,
2. Execute: Executes the statement.
3. Fetch: Fetches the data in sequential way that how plan was.
Now for this post, How to find how much time spent for each phase.
Lets look at different views and what they can offer to us,
| V$SQL |
From the shared pool, Provides sql execution details of all including cpu time, elapsed time, io time, wait time etc,
but elapsed time is for complete parse/execute/fetch
ELAPSED_TIME |
NUMBER |
Elapsed time (in microseconds) used by this cursor for parsing, executing, and fetching |
|
| dba_hist_sqlstat |
From the awr data, Provides sql execution details of all including cpu time, elapsed time, io time, wait time etc,but elapsed time is for complete parse/execute/fetch
|
|
| v$sesstat
&
v$sqlstat |
select b.sid, a.name, b.value
from v$sesstat b, v$statname a
where a.name in ('parse count (hard)', 'execute count')
and b.statistic# = a.statistic#
order by sid; |
| v$sqlstats |
From the shared pool, more or like v$sql but more robust and good. but still elapsed time is for complete parse/execute/fetch
From Documentation:-
ELAPSED_TIME |
NUMBER |
Elapsed time (in microseconds) used by this cursor for parsing, executing, and fetching |
|
|
|
| v$active_session_history |
ASH provides robust information of active sessions and what they are waiting or consuming, and can provide if a session is in parsing or execution during that sample time at least from 11gr2
IN_PARSE |
VARCHAR2(1) |
Indicates whether the session was parsing at the time of sampling (Y) or not (N) |
IN_HARD_PARSE |
VARCHAR2(1) |
Indicates whether the session was hard parsing at the time of sampling (Y) or not (N) |
IN_SQL_EXECUTION |
VARCHAR2(1) |
Indicates whether the session was executing SQL statements at the time of sampling (Y) or not (N) |
or example:-
if the sql_id is in_parse y , you have to sum the whole sample time or count it.
For example:- THe sid is 521 and sql_id is 93sdljkls0300
The following query gives you how much time the query spent on only hard parsing or executing.
select sid,sql_id,sum(delta_time) from v$active_session_history where sql_id='93sdljkls0300' and in_hard_parse='Y' group by sid,sql_id;
select sid,sql_id,sum(delta_time) from v$active_session_history where sql_id='93sdljkls0300' and in_sql_execution='Y' group by sid,sql_id; |
|
Then, What is the straight method to know how much parsing,executing fetching time?
As far as my knowledge permits and what I know, The good gold old method, sql tracing. Yes, the 10046 or sql_trace provides the information you want.
How to trace the session/sql_id Read Here
Once you trace the session or sql statement, If you look raw trace file,
PARSING IN CURSOR #12 len=169 dep=2 uid=0 oct=3 lid=0 tim=11746424128512 hv=1173719687 ad='2e7c2c50'
select col#, grantee#, privilege#,max(mod(nvl(option$,0),2)) from objauth$ where obj#=:1 and col# is not null
group by privilege#, col#, grantee# order by col#, grantee#
END OF STMT
PARSE #12:c=0,e=1024,p=0,cr=0,cu=0,mis=1,r=0,dep=2,og=4,tim=11746424128512
EXEC #12:c=0,e=3072,p=0,cr=0,cu=0,mis=1,r=0,dep=2,og=4,tim=11746424131584
FETCH #12:c=0,e=0,p=0,cr=2,cu=0,mis=0,r=0,dep=2,og=4,tim=11746424131584
As you see above the e=1024 for PARSE and e-3072 for Exec and Fetch. This way you can identify where your statement is taking much time in parsing or executing.
-Regards
GeekDBA
Hello All,
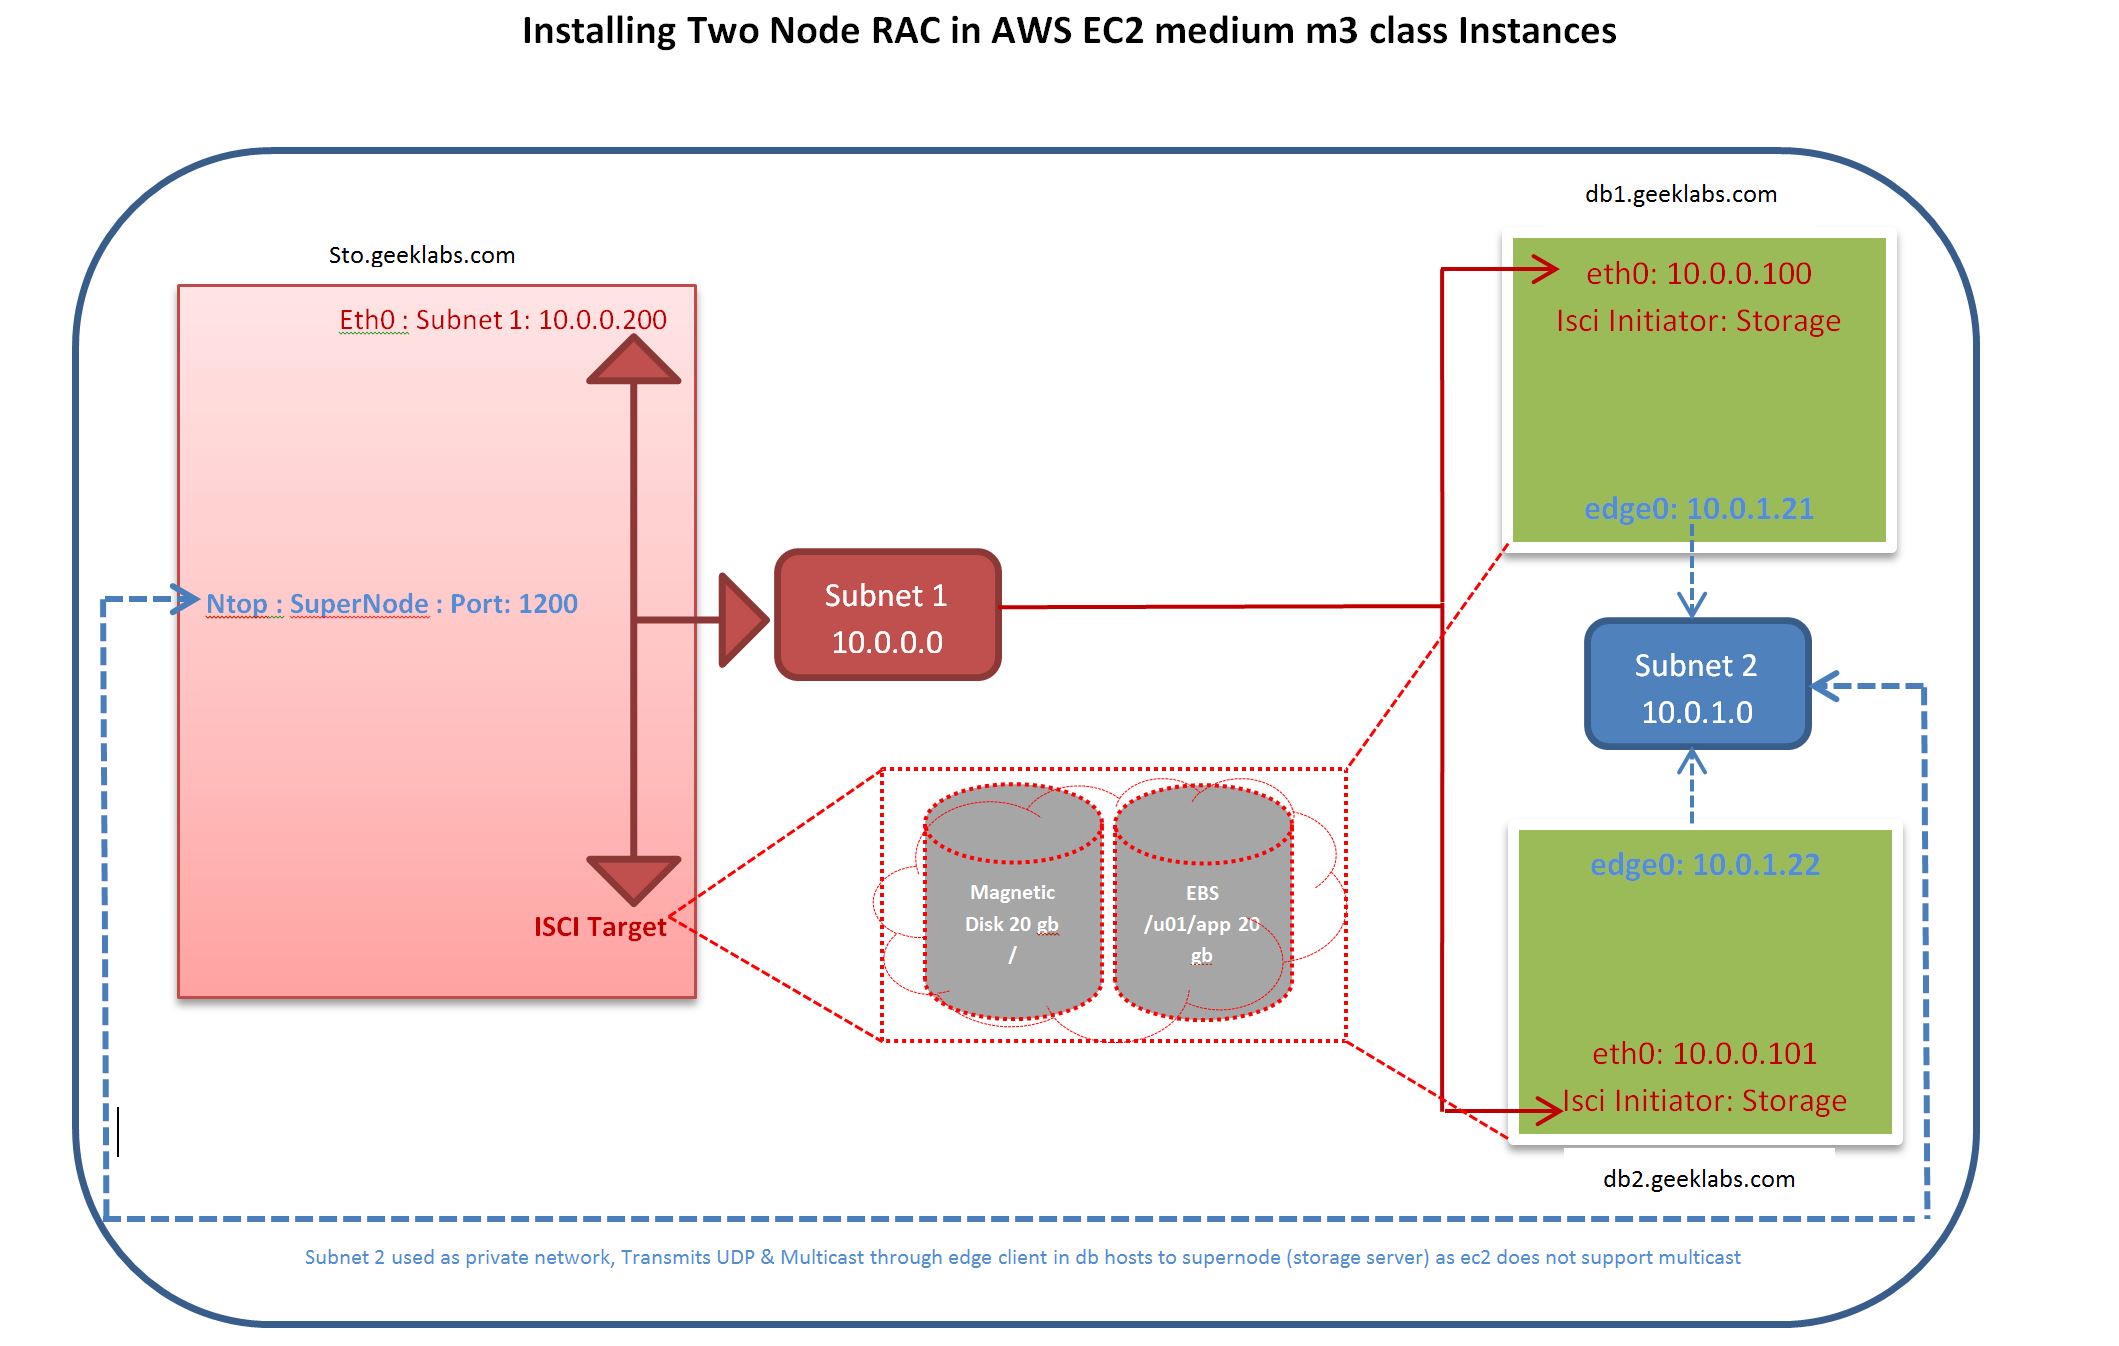
This post is specifically for those who works on Amazon Cloud and want to build a RAC on Amazon EC2 Instances (machines).
There is a very good article in the AWS Documentation Articles (here), but the linux instances taken and built were very large and per hour it cost around 4$ each machine (three machines).
For those who are looking for a cost effective testing solution, I have tried to built the RAC on m3.medium instances which costs around 15Cents per hour. Which I think phenomenal cheap. Finally, my verdict its not that easy to have the machines ready and also the following issues (at least to my knowledge, I welcome if anyone can correct me here)
- Multicast Support on EC2 Instance IP not supported: Due to this we have to rely on Ntop N2N (kind of VPN) which transmits multicast packets across nodes
- Although used N2N, the cluster haip having issues, this means you cannot have multiple private networks
- Public VIP that means Node VIP and SCAN VIP cannot be failed over as well unless you create a specific failover script to right instances
- You cannot use server pools concept since the VIP assignments are static to the nodes.
Despite of having all this , if you want to check here are the steps.
The following steps assumes
- You have an AWS account and a EC2 instance with AWS CLI installed
Node Configurations
|
Details
|
Sto.geeklabs.com
|
Db1.geeklabs.com
|
Db2.geeklabs.com
|
|
AWS Type
|
Ec2
|
Ec2
|
Ec2
|
|
Instance Class
|
M3.medium
|
M3.medium
|
M3.medium
|
|
Multicast Support
|
Ntop- Super Node
|
Ntop – edge
|
Ntop-edge
|
|
Shared Storage
|
iSCSi Target
|
iSCSi Initiator
|
iSCSi Initiator
|
|
Storage Type
|
EBS/Magnetic
|
EBS/Magnetic
|
EBS/Magnetic
|
|
Storage Size
|
Root Volume – 20gb
EBS Volumes – 10 gb * 2
|
Root Volume- 20gb
|
Root Volume -20gb
|
|
VPC
|
Custom VPC
Internet gate Way Enabled
|
Custom VPC
Internet gate Way Enabled
|
Custom VPC
Internet gate Way Enabled
|
|
Public Subnet
|
Subnet 1 : 10.0.0.74
|
Subnet 1 : 10.0.0.233
|
Subnet 1 : 10.0.0.83
|
|
Secondary Public IP’s
|
Nil
|
Subnet 1 : 10.0.0.100 (VIP)
Subnet 1 : 10.0.0.101 (SCAN)
Subnet 1 : 10.0.0.102 (SCAN)
Subnet 1 : 10.0.0.103 (SCAN)
|
Subnet 1 : 10.0.0.104 (VIP)
|
|
Private Subnet
|
Nil
|
Subnet 2: 10.0.1.21
|
Subnet 2: 10.0.1.22
|
|
OS - AWS Image
|
OEL 5.11 UEK
ami-c5b2dfff
|
OEL 5.11 UEK
ami-c5b2dfff
|
OEL 5.11 UEK
ami-c5b2dfff
|
|
|
|
|
|
Installation Document
 Loading...
The issue is there’s a query which executes quickly through 12c client in 12c database where as it is taking longer time when connecting as with 11g Clients to 12c database.
The table has a lob column and what observed is,
- 12c Client to 12c database:- During Execution of the query, direct path reads and PGA has grown upto 1.5gb, v$temporary_lobs shows the lobs created
- 11g Client to 12 c database :- During Execution of the query, db file sequential reads and PGA has consumed only 61mb, where v$temporary_lobs show nothing.
This is due to 12c clients create a server side temporary lobs (abstract lobs) and used PGA much and completed quickly.
Where in the 11g client does not have the enhancement to create abstract lobs and still fetches to the client side and caused query to run for 2 days.
This is listed as bug, 22729430 and after applying this patch the query running from 11g client also completed quickly.
Bottom Line, many things can happen especially you use many things in Oracle database. ;).
Hope this helps.
GeekDBA
Most of us know the result cache is introduced in 11g initially with pl/sql result cache and then the query result cache to store the results of query in a separate memory structures in shared pool.
As I do not want to get into how it works, what it do, may be the best start to read is documentation.
However, the results and use cases are vary from case to case for each environment.
But when you (actually developers want to use it more ) want to use you and need to know how much size for cache size is required.
By default the size is allocated automatically , from the documentation,
-
Automatic memory management
If you are using the MEMORY_TARGET initialization parameter to specify memory allocation, Oracle Database allocates 0.25% of the value of the MEMORY_TARGET parameter to the result cache.
-
Automatic shared memory management
If you are managing the size of the shared pool using the SGA_TARGET initialization parameter, Oracle Database allocates 0.50% of the value of the SGA_TARGET parameter to the result cache.
-
Manual shared memory management
If you are managing the size of the shared pool using the SHARED_POOL_SIZE initialization parameter, then Oracle Database allocates 1% of the shared pool size to the result cache.
And the parameter that controls result cache on/off is RESULT_CACHE_MODE= FORCE/MANUAL and the later as default. And you can also specify how much result cache you want to keep by using RESULT_CACHE_MAX_SIZE parameter
One of the biggest issue with Result Cache is the sessions waiting for or AWR report top events shows, Result Cache: RC Latch which can degrade performance queries/database. The two reasons mostly.
- Undersized result cache
- Concurrency of users using the same result everytime (as single Latch is covering whole result cache pool, for which the concurrent sessions reuse the same object/block in result cache can lead to greater contention)
Lets look at, Undersized Result Cache, Lets start with real example which we have recently came across (manipulated example).
A result cache size of 150MB, viewed in result cache report.
SQL> set serveroutput on
SQL> exec dbms_result_cache.memory_report
R e s u l t C a c h e M e m o r y R e p o r t
[Parameters]
Block Size = 1K bytes --> The size of each buffer in result cache is 1k
Maximum Cache Size = 257312K bytes (157312 blocks) --> Maximum Cache size 250MB
Maximum Result Size = 6665K bytes (7865 blocks) --> Maximum of size a result 6MB
[Memory]
Total Memory = 261687288 bytes [1.004% of the Shared Pool] --> Telling the 1.004% used , as we have manual memory management
... Fixed Memory = 247152 bytes [0.001% of the Shared Pool]
... Dynamic Memory = 261540136 bytes [1.003% of the Shared Pool]
....... Overhead = 452648 bytes
....... Cache Memory = 257312K bytes (257312 blocks)
........... Unused Memory = 0 blocks
........... Used Memory = 257312 blocks
............... Dependencies = 100 blocks (100 count)
............... Results = 257295 blocks --> The results cache has each 1k block 257295 blocks means 250MB
................... PLSQL = 257295 blocks (257295 count) --> And apparently most of results are using by PL/SQL objects not query results.
SQL> select name, value from v$result_cache_statistics;
NAME VALUE
------------------------------ --------------------
Block Size (Bytes) 1024
Block Count Maximum 257312 ====> 250MB
Block Count Current 257312 ====> 250MB
Result Size Maximum (Blocks) 7865
Create Count Success 427809 ====> No of times the result cache created a new results thats about 427809*1k=420MB
Create Count Failure 0
Find Count 7101 ====> No of times the queries used the result cache this will tell how effective your queries using result cache, the number 7101 out of 157312 is less than 5% used
Invalidation Count 0
Delete Count Invalid 2 ====> No of times that blocks have been deleted becoz of underlying data changes the higher the number the inefficient usage of result cache.
Delete Count Valid 70260 ====> This will tell you number of times that result cache has deleted the blocks from RC although the blocks were valid, this tells you the undersized result cache size.
As see above my result cache has more create counts and delete counts than find count. This is not at all a efficient usage of result cache, lets park what is stored in this result cache for a while and what the object is, lets think regardless of efficient usage of result cache I want to size it properly. This is required because , if the objects are waiting for result cache creating it blocks they may see degraded performance waiting for "Result Cache: RC Latch". Now we have to determine the size result cache for my database.
Size of block 1K
Count of Creation blocks sucessfully, 427809
Deleted Count of Valid blocks due to insufficient size:70260
Find count (reuse of cache) 7101
Taking consideration, 427809-7101+70260 = 490968 i.e around 420MB + 250MB current = 650MB approx. (In my example above the result_cache_max_size is not set and its used default)
The second one, concurrency of the result cache lead to "Result Cache: RC Latch", how to know, The parent address of the object in result cache tells us.
v$result_cache_objects give the name of the object and count but not the concurrent users accessing the object. indeed v$sql can provide a clue.
SQL> select sql_id,executions,elapsed_time,users_opening,users_executing where sql_id='';
The more the users_executing the contention / concurrency it has. To resolve the latch that is due to concurrency you may need to consider reducing the users executing and resulting with same package.
Finally the result cache objects can be found from. V$result_cache_objects, as you see the name contains the name of object with parent address as the parent address is same for all rows in my case.
NAMESPACE STATUS NAME NUMBER_OF_RESULTS AVG_SCAN_CNT MAX_SCAN_CNT TOT_BLK_CNT
PLSQL Published "XXXX"."XXX_PKG"::11."FUNCTIONNAME"#s43556wdfdfg#140 157042 0 5 257042
PLSQL Results "XXXX"."XXX_PKG"::11."FUNCTIONNAME"#s43556wdfdfg#140 157042 0 5 257042
PLSQL Results "XXXX"."XXX_PKG"::11."FUNCTIONNAME"#s43556wdfdfg#140 157042 0 5 257042
PLSQL Results "XXXX"."XXX_PKG"::11."FUNCTIONNAME"#s43556wdfdfg#140 157042 0 5 257042
Hope this helps.
GeekDBA
Hello
While doing some setup, I have came across a diskgroup (OCRDG) missing in CRS registry, however the diskgroup is present in the ASM instance and showing mounted.
[root@oinfo12c-rac1 ~]# crsctl stat res -t
--------------------------------------------------------------------------------
Name Target State Server State details
--------------------------------------------------------------------------------
Local Resources
--------------------------------------------------------------------------------
ora.DATA.dg
ONLINE ONLINE oinfo12c-rac1 STABLE
ONLINE ONLINE oinfo12c-rac2 STABLE
ora.LISTENER.lsnr
ONLINE ONLINE oinfo12c-rac1 STABLE
ONLINE OFFLINE oinfo12c-rac2 STABLE
ora.asm
ONLINE ONLINE oinfo12c-rac1 Started,STABLE
ONLINE ONLINE oinfo12c-rac2 Started,STABLE
ora.net1.network
ONLINE ONLINE oinfo12c-rac1 STABLE
ONLINE ONLINE oinfo12c-rac2 STABLE
ora.ons
ONLINE ONLINE oinfo12c-rac1 STABLE
ONLINE ONLINE oinfo12c-rac2 STABLE
As you see the output shows nothing about OCRDG, Lets look at asmcmd, and the OCRDG is present.
ASMCMD> lsdg
State Type Rebal Sector Block AU Total_MB Free_MB Req_mir_free_MB Usable_file_MB Offline_disks Voting_files Name
MOUNTED EXTERN N 512 4096 1048576 5114 773 0 773 0 Y DATA/
MOUNTED EXTERN N 512 4096 1048576 5114 4852 0 4852 0 N OCRDG/
Seems some permission issue, etc, do not want to spend much time on it. Just want to add it manually.
But hold there, srvctl does not have
srvctl add diskgroup
How to add it then?
We have crsctl commands which you can add resource, Trying my luck.
If you have a any other diskgroup present in the CRS as like mine (DATA diskgroup is there), Just copy and register it as like below
1) crsctl stat resource ora.DATA.dg -p > profile.txt
2) vi profile.txt
### Remove Name,Type from the file rest keep as is.
3) Add the resource
crsctl add resource ora.OCRDG.dg -type ora.diskgroup.type -file profile.txt
4) Check the status again
[root@oinfo12c-rac1 ~]# crsctl stat res -t
--------------------------------------------------------------------------------
Name Target State Server State details
--------------------------------------------------------------------------------
Local Resources
--------------------------------------------------------------------------------
ora.DATA.dg
ONLINE ONLINE oinfo12c-rac1 STABLE
ONLINE ONLINE oinfo12c-rac2 STABLE
ora.LISTENER.lsnr
ONLINE ONLINE oinfo12c-rac1 STABLE
ONLINE OFFLINE oinfo12c-rac2 STABLE
ora.OCRDG.dg
ONLINE ONLINE oinfo12c-rac1 STABLE
ONLINE ONLINE oinfo12c-rac2 STABLE
ora.asm
ONLINE ONLINE oinfo12c-rac1 Started,STABLE
ONLINE ONLINE oinfo12c-rac2 Started,STABLE
If you do not have any other diskgroup, try this
1. crsctl add resource ora.OCRDG.dg -type ora.diskgroup.type -attr ="ACL=owner:oracle:rwx,START_DEPENDENCIES=pullup:always(ora.asm) hard(ora.asm),VERSION=12.1.0.1.0"
This is should add the missing diskgroup.
Have fun.
GeekDBA
In the Previous Posts , to troubleshoot the problematic queries/long running session issues, we have sorted out two approaches, Here we discuss the Method 1
Method 1. Session Wait Event Approach:- In this approach we will try to identify from the problematic session what its waiting for , why its waiting, what can be done to resolve the problem.
The most common causes are explained here, however there may be many cases. The events classified here are can impact the instance level hence database performance can be degraded.
SQL> select sid,username,event,blocking_session,sql_id,prev_sql_id from v$session where username='username';
or
SQL> select sid,username,event,blocking_session,sql_id,prev_sql_id from v$session where sid='sid';
or
SQL> select session_id,username,event,blocking_session,sql_id,prev_sql_id from v$active_session_history where session_id='';
Concentrate on the Event column and the following events can represent you the problem. Events are mainly classified as Administration, I/O, Concurrency etc. And these notifies what the database is experiencing in terms of waits. As such the waits more the problem in that particular area is more.
For Example, you may have see the following output with above queries
<Screenshot>
As you see above the event column shows most of the times the following events and sessions are waiting for that event. Each wait event represents the issue it has and followed by solution.
|
1. Latch Cache Buffer chains:-
Problem:- As such more buffers (headers) are been read and trying to modify and have a long list of chain for each buffer and repeatable reads (more nested loops), the session get waited on doing latch cache buffer chains.
Solution:- Check the sql_id and generate execution plan, compare the execution plan with previous plan from history, and you may see more nested loops.
This is due to in correct statistics which lead to more nested loops instead of hash joins.
Collect the statistics and you rerun the statement, flush the buffer pool will help.
Read more about Join methods Read here.
|
|
2. Library Cache Lock/Pin (Cursor mutex s/x):-
Problem 1:- More locks in shared pool for the objects and reread by multiple sessions and lot of invalidations. Every time any execution happen shared pool structure should be locked and pinned until the execution completed again you do execution you have repin and lock, rather between many executions you can do only one time lock/pin that will help to reduce this issue.
Problem 2:- Invalidations (statistics collection can invalidate objects in shared pool and hence to repin and relock again, so it can one time issue but if its do more often then its a problem)
Solution:- 1. flush the shared pool,
2. kill the session that hold Lock/Pin X in event column.
3. Where the long term you can reduce this issue by setting session_cached_cursors to a reasonable number
and cursor_space_for_time to true.
|
|
3. Shared Pool Latch/Latch free:-
Problem: Inadequate shared pool size or no dynamic resize operations happening (v$sga_resize_ops), although the automatic memory management is set, sometime you will need to do a manual resizes since MMAN is busy or hanged sometimes. (from my experience I did a lot of times this stuff)
Solution:- Flush shared pool and adjust pools
1. alter system flush shared pool;
2. select name,value from v$sgastat where name like 'free%'; Observe free memory for shared pool;
3. If you do not get much free memory, give a try to resize/adjust the pools.
4. Reduce the buffer a bit and increase the shared pool a bit. to allow some resize operations.
5. show parameter db_cache_size
db_cache_size 10010000
6. Alter system set db_cache_size=9000000 (reduce a bit);
7. show parameter shared_pool_size
shared_pool_size 9809000
8. Alter system set shared_pool_size=10000000; (increased a bit which reduce from buffer pool)
Long Terms if you see this is frequently happening:
Possible increase of shared pool
if permits Set cursor_sharing to similar or force (see here)
|
|
4. Res: mgr quantum:-
Problem 1:- Sessions burning CPU or consuming more cpu or load increased, which the other sessions are waiting for CPU.
Solution:- Read here and and identify the CPU consuming processes and take appropriate actions.
|
|
5. DB File Sequential Read:- An index reads usually faster but due to index stale statistics, wrong index sessions can be doing more index scans.
Problems:- Use of an unselective index , Fragmented Indexes , High I/O on a particular disk or mount point, Bad application design, Index reads performance can be affected by slow I/O subsystem and/or poor database files layout, which result in a higher waits on this wait event.
Solutions:-
Picked Wrong Index:- It may be the case that table column is involved in two indexes and optimizer has picked the wrong index in this case.
1. SQL> select sid,username,event,sql_id,row_wait_obj# from v$session where sid='';
Note:- the row_wait_obj# tell which object_id that session is wait on , with this we know which index by checking in dba_objects with object_id and get name of index the session is waiting.
2. Identify the Plan for the query,
SQL> select * from table(dbms_xplan.display_cursor('sql_id'));
3. Identify (if any previous run history of the query)
SQL> select * from table(dbms_xplan.display_awr('sql_id'));
4. Compare the Both Plans and observer change in the index name in highlighted sections.
5. The reason would be , the statistics of index/table would have picked up wrong index (index clustering factor)
SQL> exec dbms_stats.gather_table_stats('OWNER','TABLE_NAME',CASCADE=>TRUE,no_invalidate=>false);
6. Rebuild the index that you want (probably the index that has picked up earlier) or collect statistics of the table with cascade true option would correct the issue.
SQL> alter index indexname rebuild online;
Picked Right Index only, but still slow:- It may be the case that is has picked up right index but still running slow
1. Identify the current plan and identify which index is it
SQL> select sid,username,event,sql_id,row_wait_obj# from v$session where sid='';
Note:- the row_wait_obj# tell which object_id that session is wait on , with this we know which index by checking in dba_objects with object_id and get name of index the session is waiting.
2. Identify the Plan for the query, and check the index in the plan
SQL> select * from table(dbms_xplan.display_cursor('sql_id'));
3. Identify (if any previous run history of the query)
SQL> select * from table(dbms_xplan.display_awr('sql_id'));
4. Compare the Both Plans and observe that it is same index that picked all times but this time slow.
5. The reason would be , the statistics of index/table would have picked up wrong index (index clustering factor)
SQL> exec dbms_stats.gather_table_stats('OWNER','TABLE_NAME',CASCADE=>TRUE,no_invalidate=>false);
6. Rebuild the index that you want (probably the index that has picked up earlier) or collect statistics of the table with cascade true option would correct the issue.
SQL> alter index indexname rebuild online;
|
|
6. DB File Scattered Read:- Usually full tablescans
Problem: May be that no index there for the table, a Index is present but optimizer thinks that scanning via index is costly and hence do a full tablescan. But why then optimizer decide and how it decides, it decides by means of statistics available for the table and indexes . If statistics were stale and volume of data that is retrieving by query is close to number of rows in table lead to full table scans.
|
|
7. Direct Path Reads
|
|
8. Log File Sync/Log File Parallel Write
|
|
9. Log Buffer Space
|
|
10. Buffer Free Waits
|
|
11. Buffer Busy Waits
|
|
12. Enq: Tx Row Lock Contention
|
|
13. Enq: TM Contention
|
In this part of the series, we will be looking into , how to identify the Problematic Sessions or Queries.
Before beginning, one should distinguish the question here. You may face questions like, and the answer for both is to identify either loaded sessions for a database.
1. Database is/was slow.
2. Our Session/Query is/was slow.
To make it simple, I will stick this two questions for this post now.
| Question 1: Database is/was slow |
|
First lets see how to determine is the database currently running slow.
1. AAS:- Average Active Sessions , As written here you can find the AAS as a measurement to understand the database is loaded or not.
Part 1 and Part 2 of the Series
2.Identify the most resource Consumption processes:-
But if you see the database has load i.e AAS is more then
Part 3 of the series
As by now , you might have determined the database load, by AAS, with yard stick cpu count of the database, if your AAS is less than CPU COUNT then you can simply say that database is not loaded, that means you do not have that many concurrent sessions occupying CPU (leaving other factors like IO/Memory)
Then, why they reporting slow. It might be the case that their specific session or process taking time to complete or waiting or running slow.
So you need to ask few questions now.
1. Provide more details on SID, Machine, SQL statement,, at what time the session logged on.
With the details above you can identify or pin point to session level troubleshooting.. |
|
Question 2:- Session / Query Running Slow:-
|
|
3. As you identify the session which causing issue, now look at those sessions top events.
There are two Methods and a systematic approach.
Method 1. Session Wait Event Approach:- In this approach we will try to identify from the problematic session what its waiting for , why its waiting, what can be done to resolve the problem.
Method 2. Session SQL ID Run History Approach:- In this approach we shall need to check , if the query for the session that running long has been ran before, if so ran, what is the plan before and what is the plan currently and is there any change, if so any change why it changed what caused to be changed etc.
SQL> select sid,username,status,event,sql_id,prev_sql_id,blocking_session,row_wait_obj# from v$session where sid='';
(you can replace any condition like username, machine in where clause with the information you have got from application teams)
Alternatively, you can find the series of information from v$active_session_history of every second sample for the same session using below query
SQL> select sample_time,session_id,username,event,sql_id,sql_id,prev_sql_id,blocking_session,blocking_instance,plan_hash_value from v$active_session_history where session_id='' or username='';
|
In Next series these methods will be discussed.
-Thanks
GEEKDBA
This post is about installing Exadata storage server while I am preparing for exadata certification. This is just for educational and learning purposes to understand exadata components and commands to get some hands on experience before exam.
Pre-requisities
- Install virtualbox
- Install Oracle Linux 5 Update 9 (just install this ersion only not even oracle linux 6, if not exadata may not start properly)
- Add a hard disk with 10gb to your virtualbox
Download the required softwares from OTN
- Oracle Linux 5 (update 9)
- Oracle Middleware software from edelivery.oracle.com
- For convenience , I made bundle of all required things in zip and you can download from here
Install required rpm's (if you have media mounted do rpm -ivh of these packages)
[root@stocell1 ~] yum install oracle-validated
[root@stocell1 ~] yum install perl
[root@stocell1 ~] yum install
[root@stocell1 ~] yum install unzip
[root@stocell1 ~] yum install perl
[root@stocell1 ~] yum install net-snmp-utils
[root@stocell1 ~] yum install "perl(LWP)"
Install required rpms (navigate to media folder and server/packages)
[root@stocell1 ~] rpm -ivh binutils compat-libcap1 compat-libstdc++-33 compat-libstdc++-33.i686 gcc gcc-c++ glibc glibc.i686 glibc-devel glibc-devel.i686 ksh libgcc libgcc.i686 libstdc++ libstdc++.i686 libstdc++-devel libstdc++-devel.i686 libaio libaio.i686 libaio-devel libaio-devel.i686 libXext libXext.i686 libXtst libXtst.i686 libX11 libX11.i686 libXau libXau.i686 libxcb libxcb.i686 libXi libXi.i686 make sysstat unixODBC unixODBC-devel unzip perl net-snmp-utils "perl(LWP)"
[root@stocell1 ~] rpm -ivh oracle-validated
Create swap file
dd if=/dev/zero of=/swapfile1 bs=1024 count=2097152
Add rds protocol
[celladmin@stocell1 ~] modprobe rds
[celladmin@stocell1 ~] modprobe rds_tcp
[celladmin@stocell1 ~] modprobe rds_rdma
[celladmin@stocell1 ~] vi /etc/modprobe.d/rds.conf (insert below line and save the file)
install rds /sbin/modprobe --ignore-install rds && /sbin/modprobe rds_tcp && /sbin/modprobe rds_rdma
[celladmin@stocell1 ~] lsmod | grep rds
Stop Firewall
[root@stocell1 ~] service iptables off
[root@stocell1 ~]service iptables stop
[root@stocell1 ~] chkconfig iptables off
Create directories & log directories
[root@stocell1 ~] mkdir /var/log/oracle
[root@stocell1 ~] mkdir /opt/oracle
[root@stocell1 ~] chmod 775 /var/log/oracle
Add hostname to /etc/hosts (find your machine ip address through ifconfig command and it to your etc/hosts file)
[root@stocell1 ~]vi /etc/hosts
127.0.0.1 localhost.localdomain localhost
<ipaddre> stocell1.geekslabs.com geekslabs
[root@stocell1 ~] service network restart
Install JDK 1.5.0
[root@stocell1 ~] rpm -ivh jdk-1_5_0_15-linux-amd64.rpm
Install the exadata storage software (this will install the exadata storage software)
[root@stocell1 ~] unzip cell.bin
Just in case if already installed, and removed the folder you can uninstall rpm using following
rpm -e --noscripts cell-11.2.3.2.1_LINUX.X64_130109-1
[root@stocell1 ~] rpm -ivh cell-11.2.3.2.1_LINUX.X64_130109-1.x86_64.rpm
I have 10gb disk, create 4 1024M disks, create following script and ensure change the /dev/xvdh with your disk
[root@stocell1 ~] vi partitions.sh
#!/bin/bash
for i in {1..20}
do
cat <<EOF | fdisk /dev/sdb
n
p
{$i}
+500M
w
EOF
done
Run the script, it will create 10 partitions with 1gb each.
[celladmin@stocell1 ~] sh partition.sh
Create Softlink to the disk partitions and make them as raw disks
cd /opt/oracle/cell11.2.3.2.1_LINUX.X64_130109/disks
mkdir -p disks/raw
cd disks/raw
ln -s /dev/sdb1 cell12_DISK1
ln -s /dev/sdb2 cell12_DISK2
ln -s /dev/sdb3 cell12_DISK3
ln -s /dev/sdb4 cell12_DISK4
ln -s /dev/sdb5 cell12_DISK5
ln -s /dev/sdb6 cell12_DISK6
ln -s /dev/sdb7 cell12_DISK7
ln -s /dev/sdb8 cell12_DISK8
ln -s /dev/sdb9 cell12_DISK9
ln -s /dev/sdb10 cell12_DISK10
ln -s /dev/sdb11 cell12_DISK11
Create the Cell services using cellcli, as celladmin
[celladmin@stocell1 ~]su - celladmin
[celladmin@stocell1 ~]cellcli -e create cell cell12 interconnect1=eth0
Start the cell services
[celladmin@stocell1 ~]$ cellcli -e alter cell restart services all
Stopping the RS, CELLSRV, and MS services...
CELL-01509: Restart Server (RS) not responding.
Starting the RS, CELLSRV, and MS services...
Getting the state of RS services... running
Starting CELLSRV services...
The STARTUP of CELLSRV services was successful.
Starting MS services...
The STARTUP of MS services was successful.
Create Cell Disks, this will create the cell disks for all the raw disks we have created
[celladmin@stocell1 ~]$ cellcli -e create celldisk all
Login and check cell disks created or not,
[celladmin@stocell1 ~]$ cellcli
CellCLI> list celldisk
CD_DISK10_cell12 normal
CD_DISK11_cell12 normal
CD_DISK1_cell12 normal
CD_DISK2_cell12 normal
CD_DISK3_cell12 normal
CD_DISK4_cell12 normal
CD_DISK5_cell12 normal
CD_DISK6_cell12 normal
CD_DISK7_cell12 normal
CD_DISK8_cell12 normal
CD_DISK9_cell12 normal
Create Grid Disks
[celladmin@stocell1 ~]$ cellcli -e create griddisk all harddisk prefix=DATA
Login and check cell disks created or not,
CellCLI> list griddisk
DATA_CD_DISK10_cell12 active
DATA_CD_DISK11_cell12 active
DATA_CD_DISK1_cell12 active
DATA_CD_DISK2_cell12 active
DATA_CD_DISK3_cell12 active
DATA_CD_DISK4_cell12 active
DATA_CD_DISK5_cell12 active
DATA_CD_DISK6_cell12 active
DATA_CD_DISK7_cell12 active
DATA_CD_DISK8_cell12 active
DATA_CD_DISK9_cell12 active
Check Luns (in this case they are just a bunch of raw disks otherwise they point to hard disks)
CellCLI> list lun
/opt/oracle/cell11.2.3.2.1_LINUX.X64_130109/disks/raw/cell12_DISK1 /opt/oracle/cell11.2.3.2.1_LINUX.X64_130109/disks/raw/cell12_DISK1 normal
/opt/oracle/cell11.2.3.2.1_LINUX.X64_130109/disks/raw/cell12_DISK10 /opt/oracle/cell11.2.3.2.1_LINUX.X64_130109/disks/raw/cell12_DISK10 normal
/opt/oracle/cell11.2.3.2.1_LINUX.X64_130109/disks/raw/cell12_DISK11 /opt/oracle/cell11.2.3.2.1_LINUX.X64_130109/disks/raw/cell12_DISK11 normal
/opt/oracle/cell11.2.3.2.1_LINUX.X64_130109/disks/raw/cell12_DISK2 /opt/oracle/cell11.2.3.2.1_LINUX.X64_130109/disks/raw/cell12_DISK2 normal
/opt/oracle/cell11.2.3.2.1_LINUX.X64_130109/disks/raw/cell12_DISK3 /opt/oracle/cell11.2.3.2.1_LINUX.X64_130109/disks/raw/cell12_DISK3 normal
/opt/oracle/cell11.2.3.2.1_LINUX.X64_130109/disks/raw/cell12_DISK4 /opt/oracle/cell11.2.3.2.1_LINUX.X64_130109/disks/raw/cell12_DISK4 normal
/opt/oracle/cell11.2.3.2.1_LINUX.X64_130109/disks/raw/cell12_DISK5 /opt/oracle/cell11.2.3.2.1_LINUX.X64_130109/disks/raw/cell12_DISK5 normal
/opt/oracle/cell11.2.3.2.1_LINUX.X64_130109/disks/raw/cell12_DISK6 /opt/oracle/cell11.2.3.2.1_LINUX.X64_130109/disks/raw/cell12_DISK6 normal
/opt/oracle/cell11.2.3.2.1_LINUX.X64_130109/disks/raw/cell12_DISK7 /opt/oracle/cell11.2.3.2.1_LINUX.X64_130109/disks/raw/cell12_DISK7 normal
/opt/oracle/cell11.2.3.2.1_LINUX.X64_130109/disks/raw/cell12_DISK8 /opt/oracle/cell11.2.3.2.1_LINUX.X64_130109/disks/raw/cell12_DISK8 normal
/opt/oracle/cell11.2.3.2.1_LINUX.X64_130109/disks/raw/cell12_DISK9 /opt/oracle/cell11.2.3.2.1_LINUX.X64_130109/disks/raw/cell12_DISK9 normal
Finally, Check your Cell Service Details
[celladmin@stocell1 ~]$ cellcli
 CellCLI: Release 11.2.3.2.1 - Production on Tue Aug 01 07:48:51 EDT 2017
 Copyright (c) 2007, 2012, Oracle.  All rights reserved.
 Cell Efficiency Ratio: 1
 CellCLI> list cell detail
 name:                   cell12
 bbuTempThreshold:       60
 bbuChargeThreshold:     800
 bmcType:                absent
 cellVersion:            OSS_11.2.3.2.1_LINUX.X64_130109
 cpuCount:               1
 diagHistoryDays:        7
 fanCount:               1/1
 fanStatus:              normal
 flashCacheMode:         WriteThrough
 id:                     29bf45c9-e189-4221-84bd-3683593d0e7a
 interconnectCount:      1
 interconnect1:          eth0
 iormBoost:              0.0
 ipaddress1:             10.0.0.136/24
 kernelVersion:          2.6.39-400.215.11.el5uek
 makeModel:              Fake hardware
 metricHistoryDays:      7
 offloadEfficiency:      1.0
 powerCount:             1/1
 powerStatus:            normal
 releaseVersion:         11.2.3.2.1
 releaseTrackingBug:     14522699
 status:                 online
 temperatureReading:     0.0
 temperatureStatus:      normal
 upTime:                 0 days, 0:30
 cellsrvStatus:          running
 msStatus:               running
 rsStatus:               running
MS and RS Services running and as well as cellsrv.
And if you look above make model show as fake hardware since we run as simulator not original exadata hardware.
This concludes the storage software installation and in next post we will see how to use this grid disks as ASM disks.
In the previous series we have seen how to troubleshoot IO, CPU and Database TimeSpent/Consumed,
Today's Post I will be sharing with you the most common issues or to tackle memory related questions.
As we all know Oracle does manage things (blocks/modifications) in memory and track them in memory and sort them in memory and store them in memory and users first read the memory structures only not the disk.
So how big the memory should be, Does that memory is adequate sized, if not what kind of waits you will be seeing specifically for those memory structures like PGA, Shared Pool, Buffer Cache etc.
I will be starting as of 10g only, these so called memory structures are managed by oracle by MMAN & MMNL processes when sga_target/memory_max_target is set > 0. That means if any of the pools with in SGA is required to adjust with in themselves these background process help to do that for you. In earlier versions , DBA has to manually resize them as require during batch timings and during day timings (I am the one of those DBA too who did it often previously). So that relieves a major work from DBA. But there are many questions about SGA utilization and PGA utilization and sizing and historical usage.
Okay, now proceed with typical question and answers and related troubleshooting tips.
| Question |
Views Needed |
Description |
Historical Queries |
| A new database, How much SGA/PGA you need? |
None |
This is tricky, you cannot fit entire database into memory.
So ideally when a new database anticipating the common sizing start with 2g for medium and 4g for larger instances and you will need to capacity plan until you have some baseline. To capacity plan the next row will answer the question |
|
| A older database, Capacity Plan the SGA/PGA? |
Current:-
v$sga_target_advice
v$pga_target_advice
v$shared_pool_advice
v$db_cache_advice
v$memory_target_advice
historical:-
dba_hist* |
To Understand Current/Historical SGA sizing and performance
SQL> select * from v$sga_target_advice; SQL> select * from dba_hist_sga_target_advice where snap_id =&id;
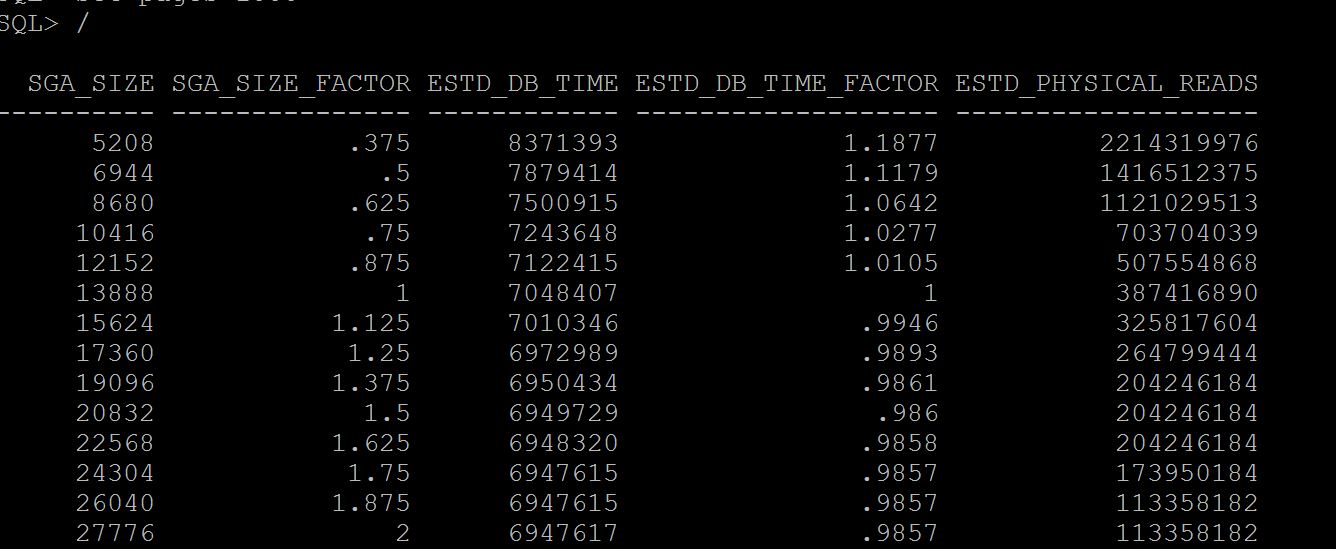
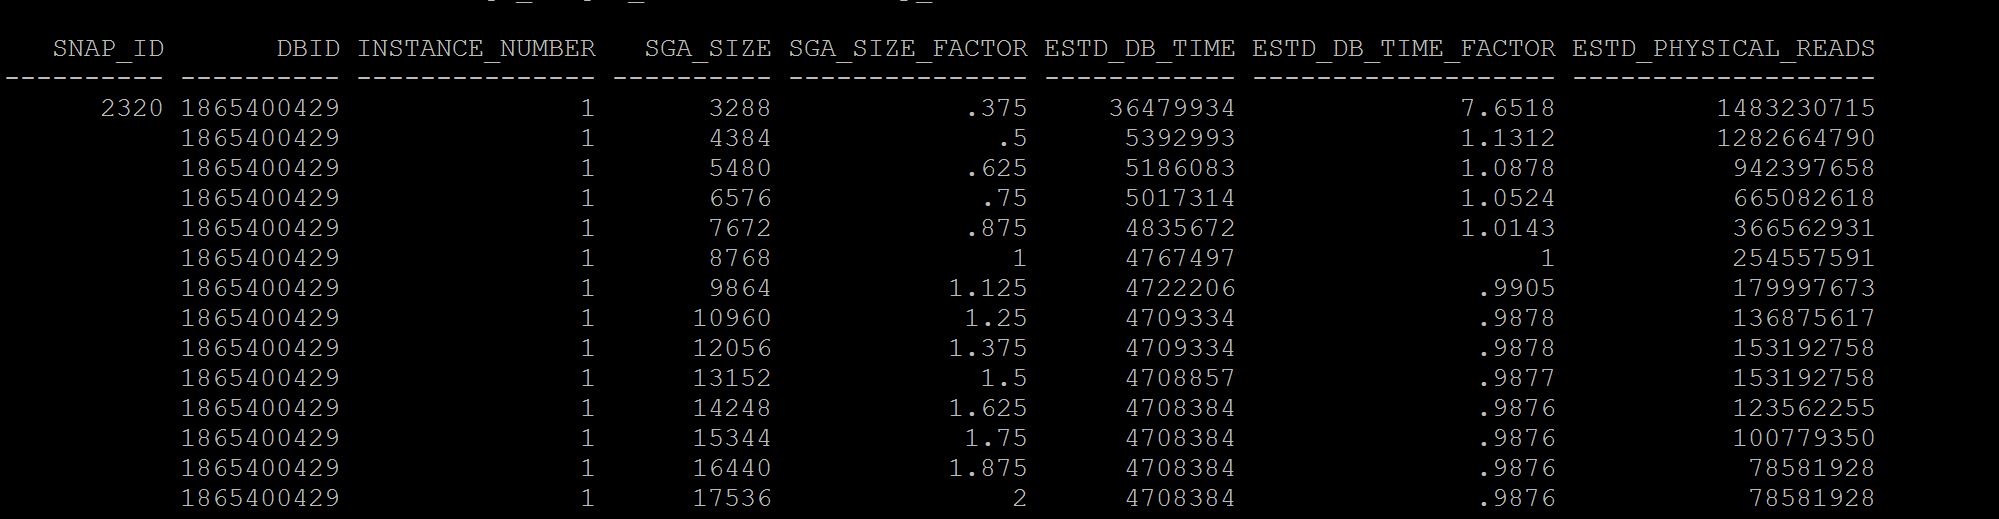
Notes:- See at column sga_size_factor, where there is 1, its your current setting of sga, so when you have this setting size for example in above case 13gb the number of estimated physical reads were 387416890, if we increase to double the size i.e where the sga_size_factor is 2, i.e 27gb (last line) our database just have 113358182 physical reads. So there may be benefit. If benefit is less that means your sga is adequate and need to increase. Not only physical reads you can see the estimated db time from 7048407 to 6947617 it varies, that means I dont have benefit in terms of DB time but may benefit from physical reads.
If you are running a 11g memory management features i.e SGA+PGA combined use v$memory_target_advice instead.
To Understand Current/Historical PGA Sizing and performance
SQL> select * from v$pga_target_advice; SQL> select * from dba_hist_pga_target_advice where snap_id=&id;
Good one Bad One
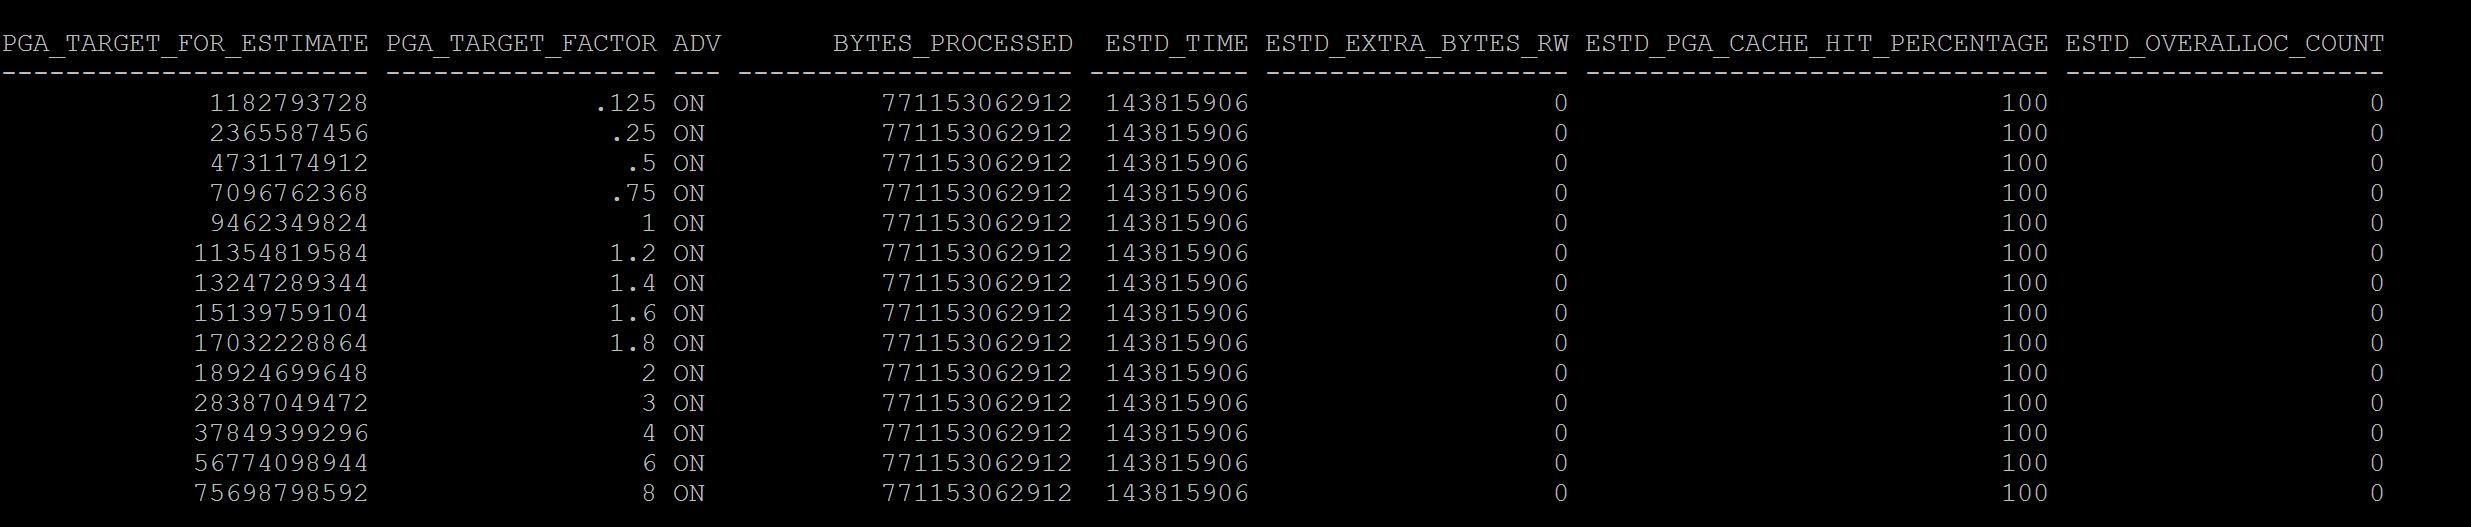 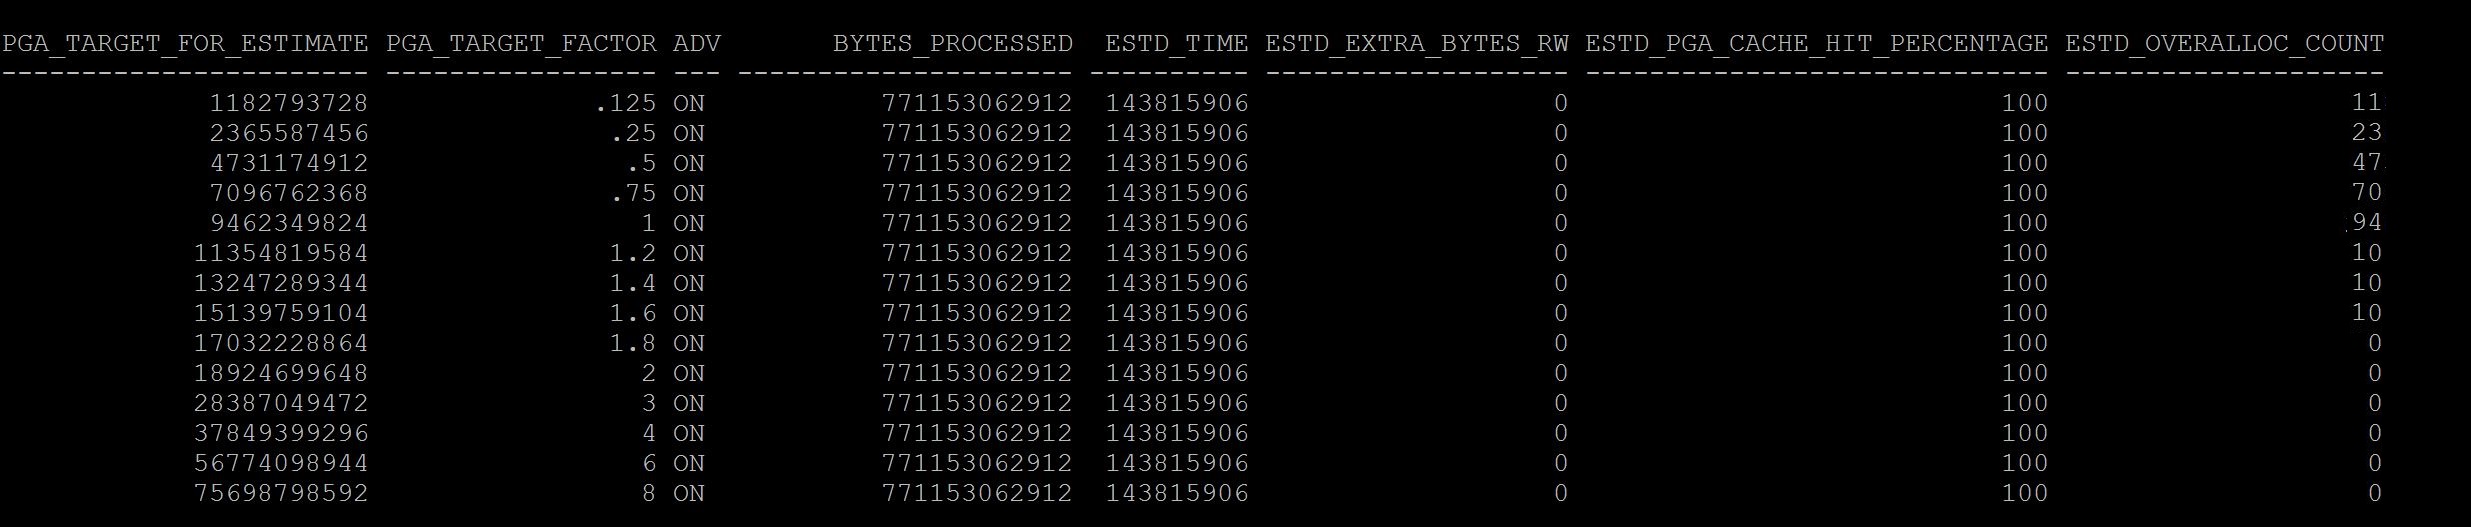
What you have observed between good and bad screenshots?
The current value again stays with pga_target_factor column and where it shows 1, that means the current pga is 9gb, where in the difference is and a rule of thumb the estimated_overalloc_count should always be 0 at your current setting . If not you may need to consider increasing the pga_aggregate_target parameter, So in Good screenshot at size 1 it has 0 estimated_overalloc_count where in the Bad screenshot it shows that 94 times oracle has to do more asking os calls/internal to increase pga. Which is not good.
Although pga_aggregate_target parameter if you set at ex: 9gb , if its required session server process will use more than 9gb from os free memory with sysop calls. but if its passing that limit of 9gb it has to fetch from OS free memory and increase estimated overalloc count, if its not able to get free memory then session/server process fails with ora-4030 error, process out of memory error. So pga limit is just a soft limit until 11g, in 12c you can restrict this behaviour with parameter pga_aggregate_limit
With above, you might have understood the sizing of pga and sga setting in database is adequate or not, and those historical ones too. This will be a starting point to any of the DBA's to estimate the sga/pga sizing.
If you want to understand about specifically buffer_pool and shared_pool advisory you can read from here |
|
| Session/Statement utilization of SGA/PGA ? |
v$sgastat
v$pgastat
v$process_memory
v$process_memory_detail
v$sesstat
v$active_session_history
dba_hist_active_sess_history |
For SGA:-
To understand current sizes for each pool in the instance?
SQL> select pool,sum(bytes)/1024/1024 from v$sgastat group by pool;
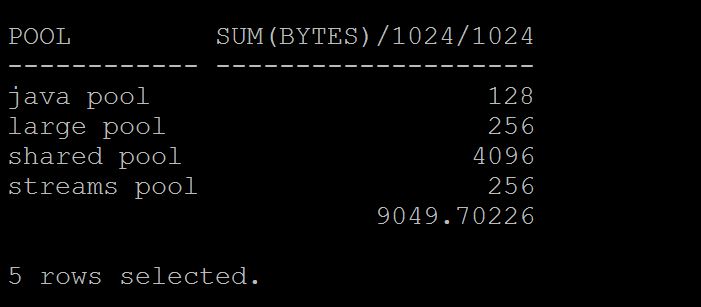
To Understand current free size with in each in the instance?
SQL> select pool,name,sum(bytes)/1024/1024 from v$sgastat where name='free memory' group by pool,name;
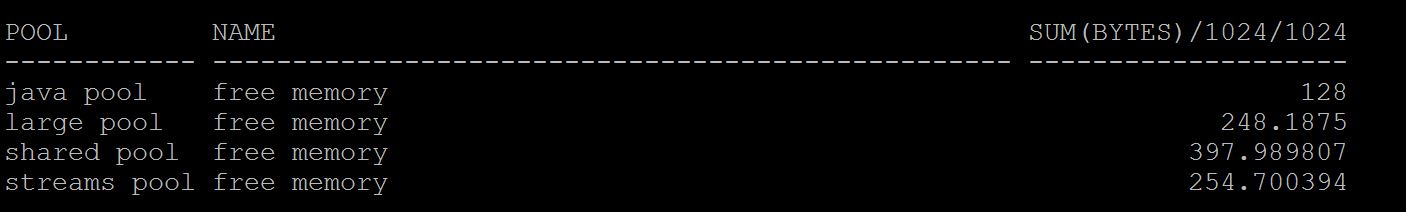
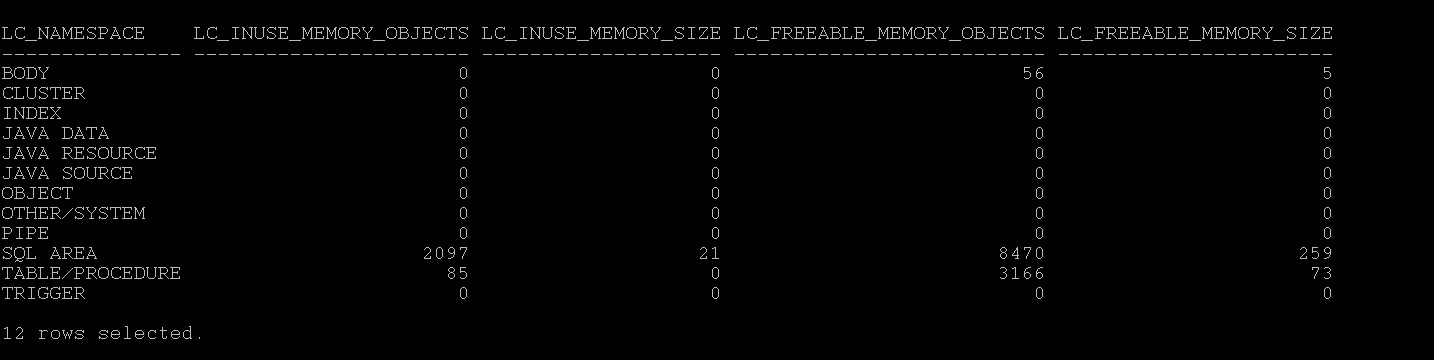
To Understand current utilization of shared pool by each object that occupied,
SQL> select type,round(sum(sharable_mem)/1024/1024,2) from v$db_object_cache group by type order by 2 desc;
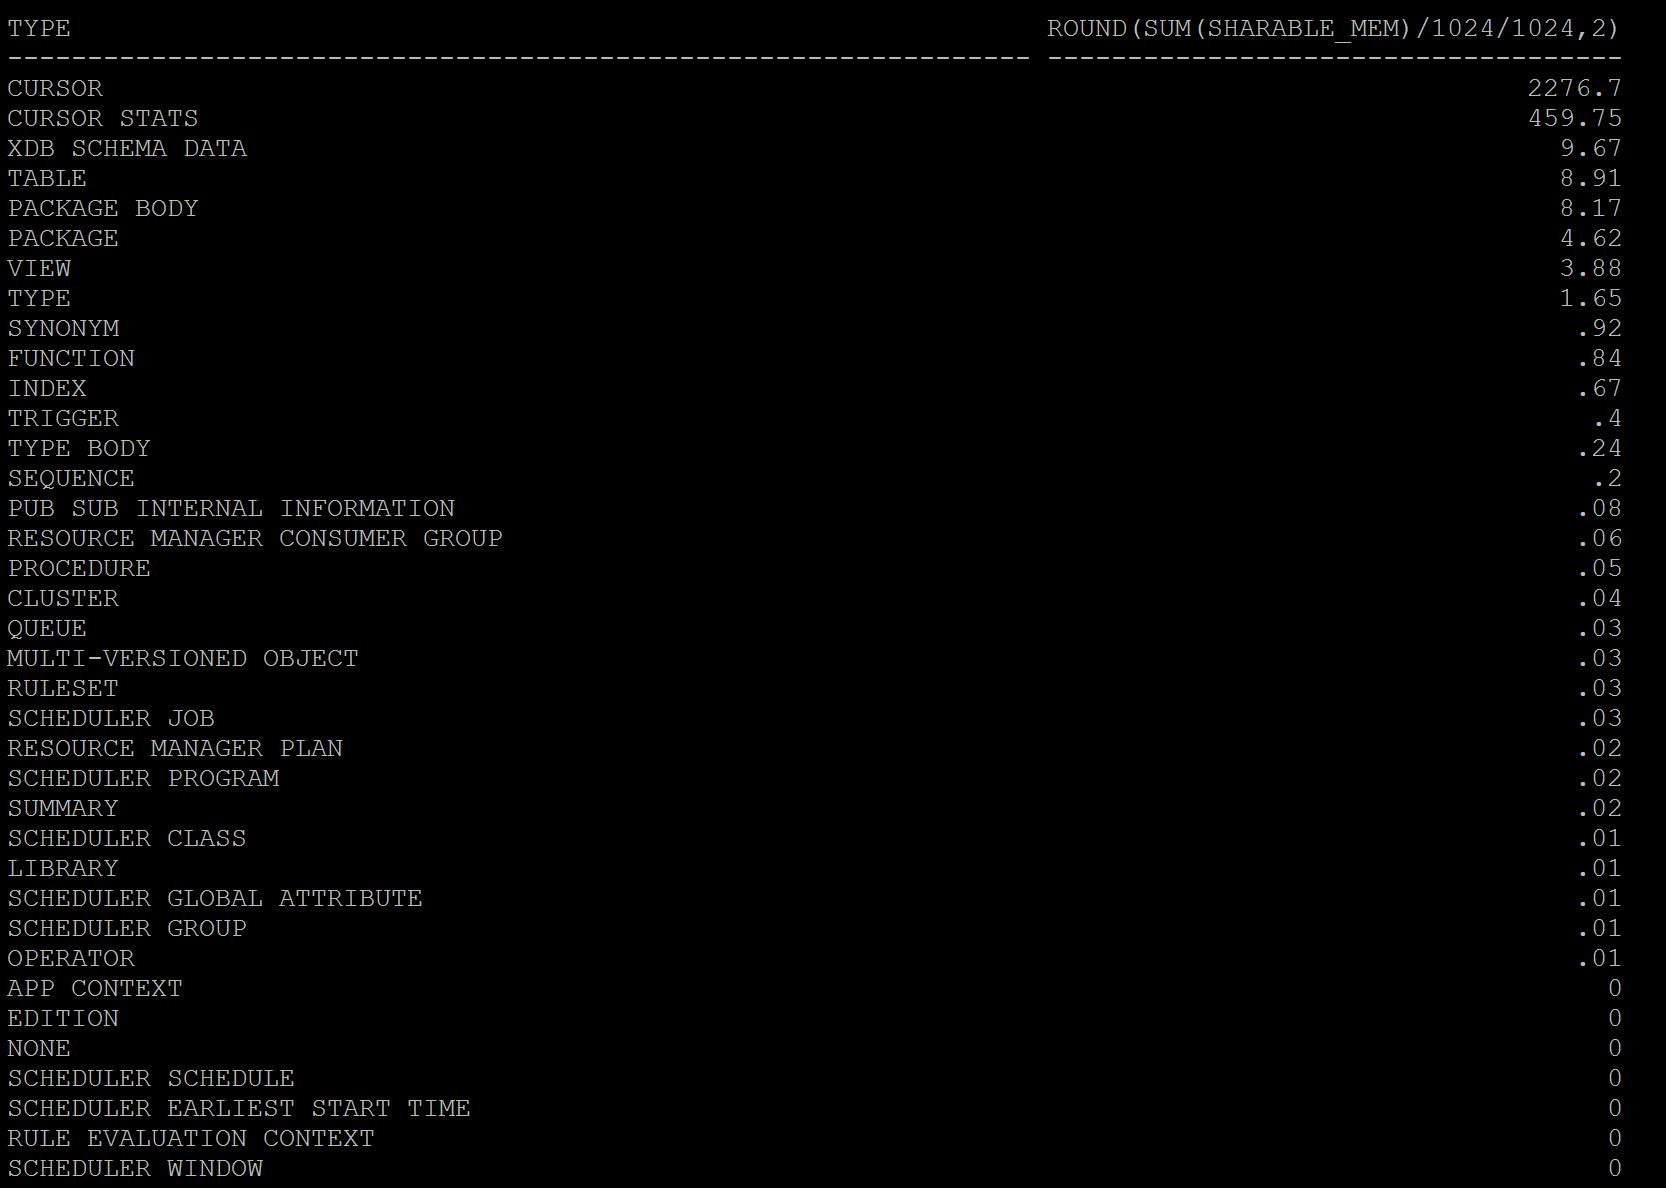
As you see above cursors i.e plain sql statements using 2.2 gb and cursor statistics taking 450mb of utilization and rest others. So here most of my shared pool utilization is going for simple sql statements. If you want you can further break this query with specific user group by.
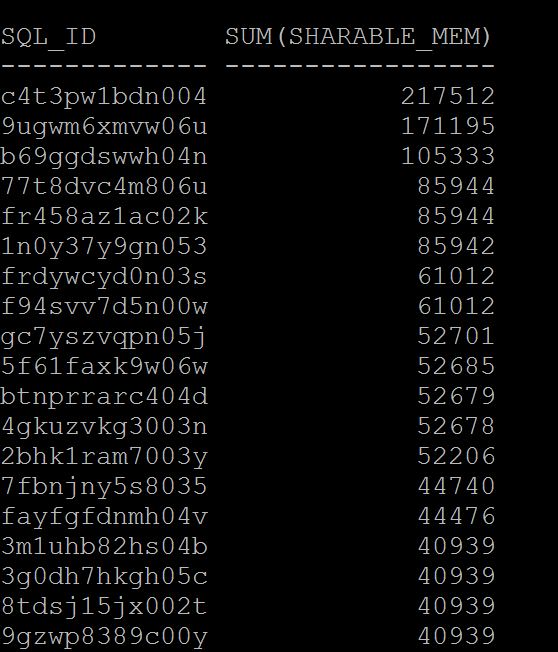
To understand current utilization by each statement,
SQL> select sql_id,sum(sharable_mem) from v$sql where rownum < 100 group by sql_id order by 2 desc;
For PGA:-
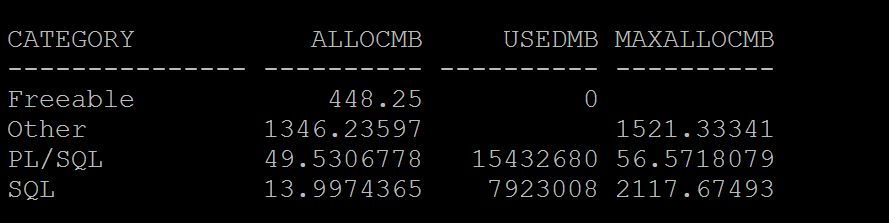
To Understand total Process memory usage overall,
SQL> select category,sum(allocated)/1024/1024 AllocMB,sum(used) UsedMB, sum(max_allocated)/1024/1024 MaxAllocMB from v$process_memory group by category;
To Understand specific session PGA utilization under which area.
SQL> SELECT s.sid,pm.allocated/1024/1024 Alloc_MB, used/1024/1024 UsedMB, Max_allocated/1024/1024 MaxAllocMB FROM v$session s, v$process p , v$process_memory pm WHERE s.paddr = p.addr AND p.pid = pm.pid AND s.sid IN (&1) ORDER BY sid, category;
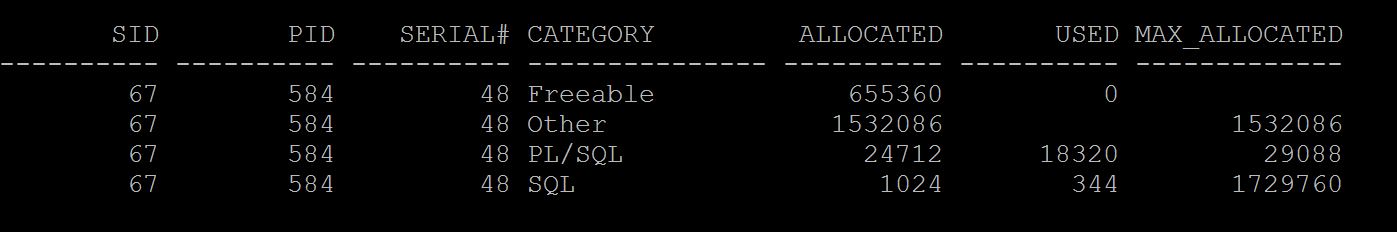
As you see above the majority area goes to Other section of PGA consumption that means, Hash/Sorting etc. We need to understand what causing more pga utilization using workarea active. Work areas are sort area and hash area with in PGA to store the data that need to hash grouped or sorted.
SQL> select inst_id,sid,sql_id,operation_type,sum(actual_mem_used)/1024/1024,sum(work_area_size)/1024/1024, sum(tempseg_size)/1024/1024 from gv$sql_workarea_active group by inst_id,sid,sql_id,operation_type;
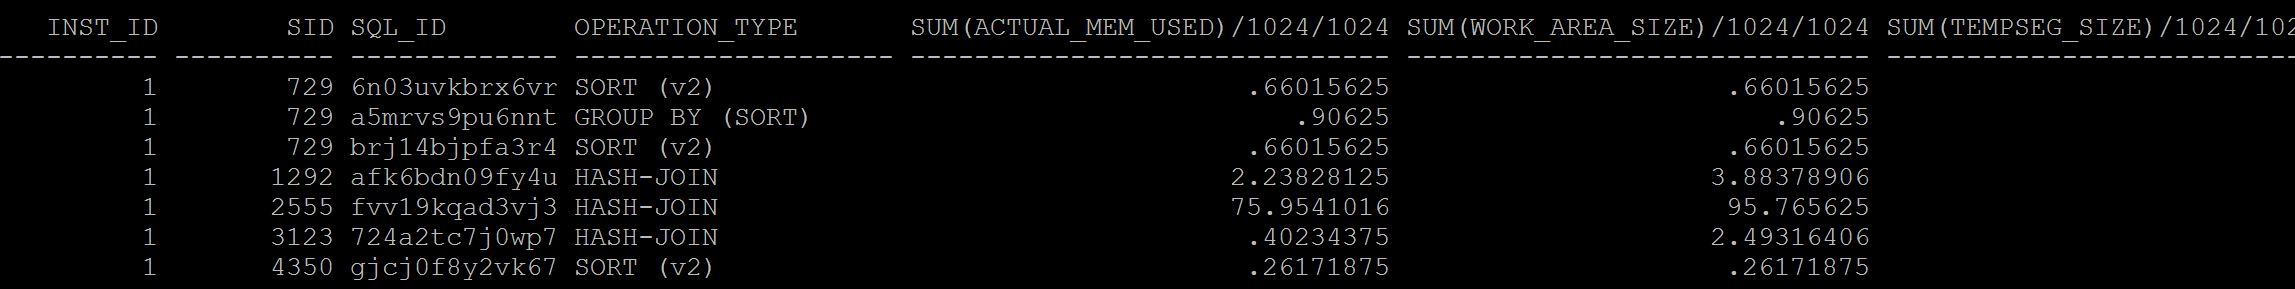
As you see which SID, SQL_ID and which area of workarea i.e hashing or sorting using more PGA can be found easily above.
Run the current_pga_by_session.sql also provide the information overall usage for each session as below.
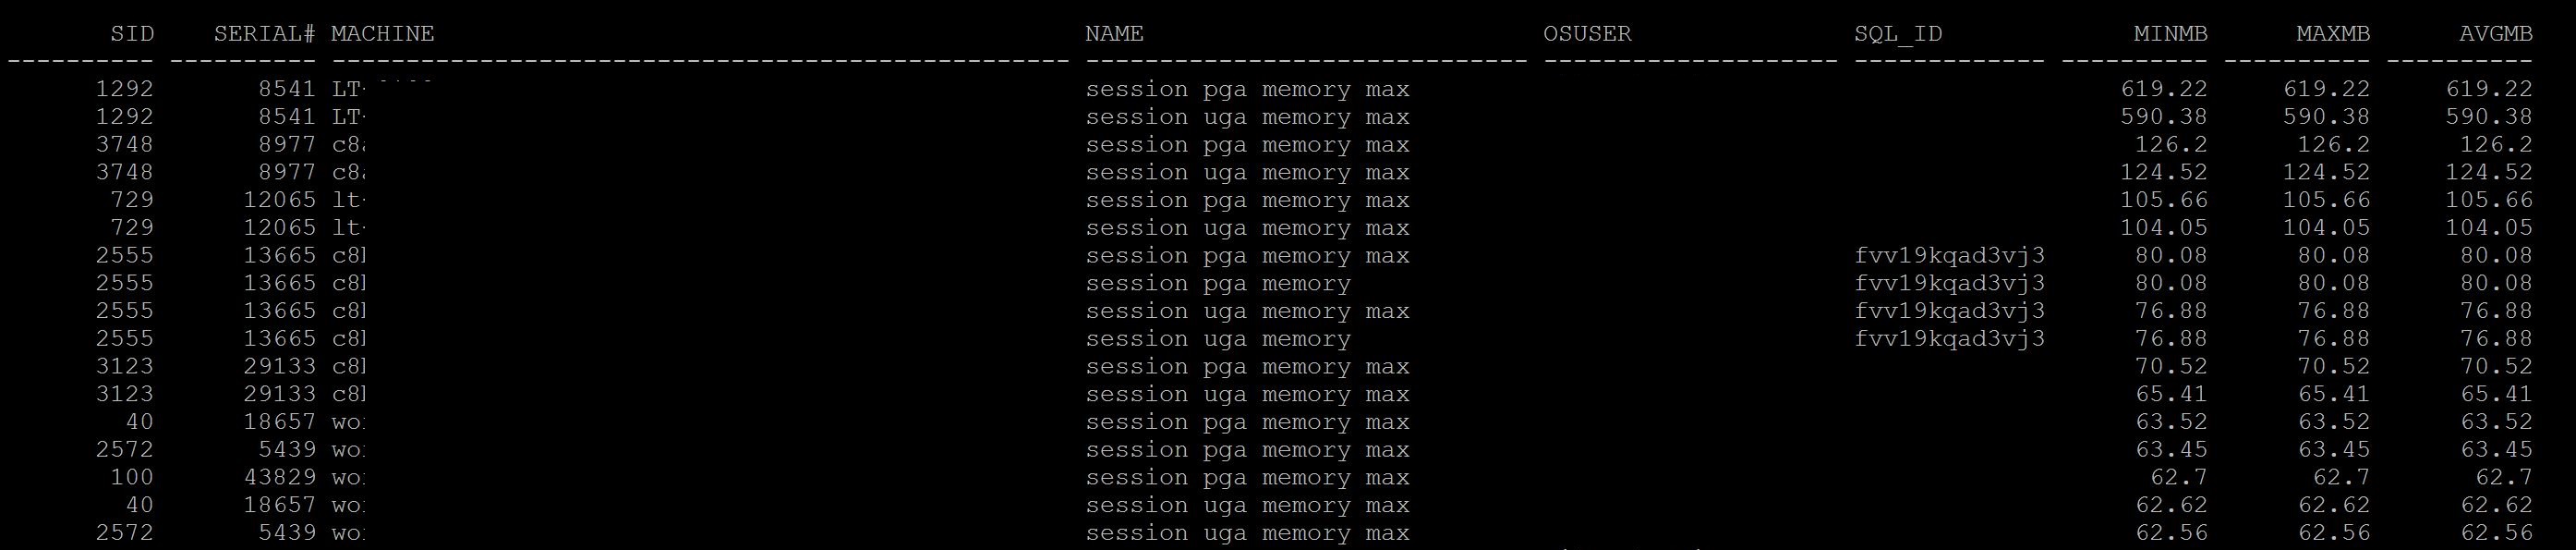
From 11R2 Onwards you can get individual pga allocation from v$active_session_history only.
sql> select session_id,event,status,session_state,pga_allocated,temp_space_allocated from v$active_session_history where session_id='';
For Historical you run
sql> select session_id,event,status,session_state,pga_allocated,temp_space_allocated from dba_hist_active_sess_history where session_id=&sessionid and snap_id between &BEGIN_SNAP and &END_SNAP;
From historical metrics, you can access the pga allocation for each snap by
SQL> select snap_id,metric_name,max_val,avg_val from dba_hist_sysmetric_summary where metric_name='Total PGA Allocated';
As you got SQL_ID & SID you can see further where is full table scan is happening and reducing the full scan can eliminate hash area usage thus by pga consumption. And for sorts look out data and if it really needed to keep order by clause. |
|
| Does instance/sessions is experiencing any memory related waits? |
v$system_event
v$session
v$active_session_history
dba_hist_active_sess_history
dba_hist_system_event |
If you have inadequate sga or pga there may be some waits that user experience, the following are the most common waits that can visible in wait event column for those sessions.
For SGA:-
For Buffer Pool:- free buffer wait, either your buffer pool is inadequate or dbwr is not enough to write quickly to the disk and the session waiting on this wait event to keep their blocks into buffer cache and waiting.
For Shared Pool:- latch free or latch: shared pool, these waits will be occur when there is in adequate shared pool allocated to instance and waiting to get an allocation of memory structure to parse query (SQLAREA)
For log_buffer:- redo buffer allocation retries, although this pool is not adjusted dynamically and if you less size allocated you will see this wait even its time to increase the log buffer too.
For PGA:-
direct path read, direct path read direct events appear if there is more PGA is consumed actually its a adverse affect, direct path reads consume pga memory and keep buffers in pga rather sga buffer pool. This is more in 11gr2 which should be addressed properly.
Note: latch cache buffer chains, library cache lock, cursor pin x/s, row cache lock, buffer busy wait etc, are related to concurrency issues not memory related waits.
Identify Wait Events from Current (V$session/v$active_session_history) or from AWR/Statspack
For Current:- |
|
| Common Errors that can be caused by inadequate memory structures |
Alert Log
Session/Query Failures |
For Shared Pool:- ora-4031
Usually a statement failed or in alert you will see this
ORA-04031: "unable to allocate n bytes of shared memory ("shared pool", "object_name", "alloc type(2,0)" ...)
Few things note in above line, which pool Shared Pool, object name is namespace in db_object_cache like sql area, plsql or table or which part of shared pool structure it is unable to allocate, and how many bytes it unable to.
Generally, whenever a new query is need to parsed that need to obtain a latch for specific size bucket for the query size and memory structure is obtained and parsing will be done. In this process when a memory structure is not available for that query size particularly then its leads to this issue.
However small sized shared pool also can lead this since there is no free memory and no latch to obtain therefore no memory structure. Hence query fails.
Again, shared pool is divided into multiple subpools with number of buckets with different sizes, you can see this output and query to check in your database shared_pool_buckets.sql
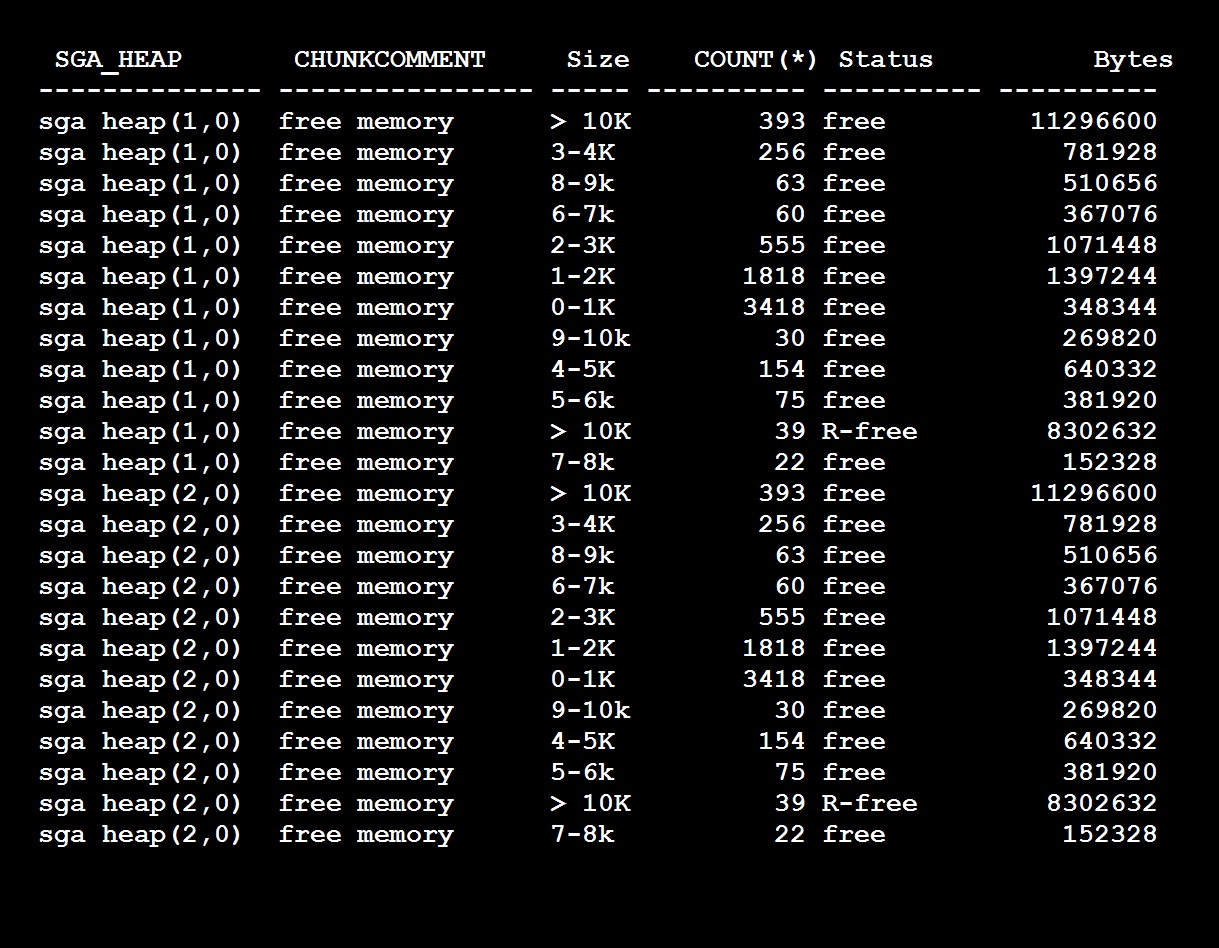
As you see I have two pools (sgaheap(1,0) and sgaheap(2,0) with in shared pool and each pool contains free memory chunks of different sizes and also reserved free memory. So if my query requires for example 4K chunk and it can go to any pool and obtain the free chunk out of it. As many queries fire against of same size and 4K chunk is 0 then if any other query goes to pool 1 and there is no free chunk available it fails with ora-4031 unable to allocate 4096 bytes (sqlarea.....) like this.
Unfortunately, even if you have pool 2 having 4k Chunk it will not allocated to the failed query. Since your query has acquired a latch for pool 1.
How to resolve it,
So first identify whether your shared pool has free memory with in pool,
SQL> select pool,name,sum(bytes)/1024/1024 from v$sgastat where name='free memory' group by pool,name;
So as such you have free memory available even still the query is failing means you got the above issue, i.e shared pool fragmentation, since the shared pool is divided into multiple pools and the free chunks are distributed evenly/proportionally to the pools. This is required to reduce the waiting on long list of latch and introduced from 8i I think.
Again, unluckily there is no hard fact rule how many pools you need for a given sized shared pool, so its upto you how many pools you need, try to reduce the pools to the average, for example give a size of shared pool about 10g you may have 2 to 3 pools, if so try to reduce to 2.
Note:- Do not reduce to 1 never, this may cause another issue long waiting of latching queue. since there is only one pool and latch list will be long and hence parsing time will be more (indirectly CPU consumption).
How to check how many pools and the parameter,
SQL> select distinct ksmdsidx from x$ksmss;
KSMDSIDX
----------
1
2
SQL> Show parameter _kghdsidx_count
2
Note: Changing this parameter may need bounce
For PGA - ora-4030
ora-4030 , out of process memory, There are numerous possibilities for this issue, however in an normal running system and no issues before, the following may be the cause
1. Inadequate free memory at OS
If you see more resize operations like PGA_TARGET GROW always then the PGA is inadequate and you must increase the PGA or try to reduce the following.
Secondly, Identify where PGA utilization is more,
SQL> select category,sum(allocated)/1024/1024 AllocMB,sum(used) UsedMB, sum(max_allocated)/1024/1024 MaxAllocMB from v$process_memory group by category;
1. More hash joins i.e more full table scans. Identify the tables/statements that involved in
tablescans_by_session.sql fulltable_scans_statements.sql
2. More direct path reads, Identify tables that are involved in direct path reads which consume pga (11gr2) and avoid full tablescans on them
3. More Sorting, identify which statement having more sorts |
|
| Improving Shared Pool Efficiency |
v$sqlstat
v$sqlarea
v$library_cache_memory
v$sql_shared_pool |
First understand how is your shared pool utilization,
SQL> select round(bytes/(1024*1024),0) count, 'Shared Pool Size' info from v$sgainfo where name = 'Shared Pool Size' union all select count(*), 'Unique sql statements' from v$sql_shared_cursor where child_number = 0 union all select count(*), 'Same sql but not first copy'from v$sql_shared_cursor where child_number >= 1 union all select count(*), 'Execution plans' from v$sql_shared_cursor union all select count(*), 'Count from sqlarea' from v$sqlarea;
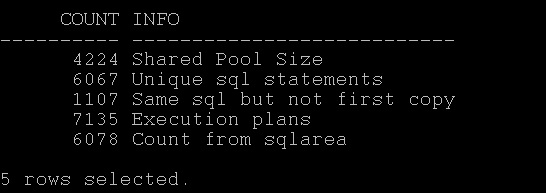
As you see, the database is more unique statements than common statements and closer number of executions plans observed too. That means this database is firing more unique statements and cannot be shared.
Secondly, how is library cache utilization under which namespace,
SQL> select * from v$library_cache_memory;
As we observed above the library is used mostly in sqlarea i.e cursors or statements not the others.
Solution:-1
1. Sharing your cursors at application level, if not possible at DB level with cursor_sharing=force or similar , read here
2. If you see in time model statistics the soft parse is taking more time, then increase session_cached_cursors and cursor_space_for_time=true. at parameter level. (mostly you will be seeing library cache lock and library cache latch or cursor pin s etc as wait events for this sessions)
3. Identify the plans that frequently changing by using sql_plan_changes.sql and fix them with profile may help.
4. Reduce the DDL while DML is running/batches or running to avoid more invalidations, like statistics collection, partition maintenance
Run this query it will give overall picture of shared pool utilization of top 5 statements in terms of disk/buffer/memory/cpu/executions:- current_expensive_queries.sql |
|
| Improving Buffer Pool Efficiency |
v$bh
v$buffer_pool
x$bh |
First understand how many buffers you have in the buffer pool at the moment.
SQL> SELECT name, block_size, SUM(buffers) FROM V$BUFFER_POOLGROUP BY name, block_size HAVING SUM(buffers) > 0;
NAME BLOCK_SIZE SUM(BUFFERS)
-------------------- ---------- ------------
DEFAULT 8192 1174567
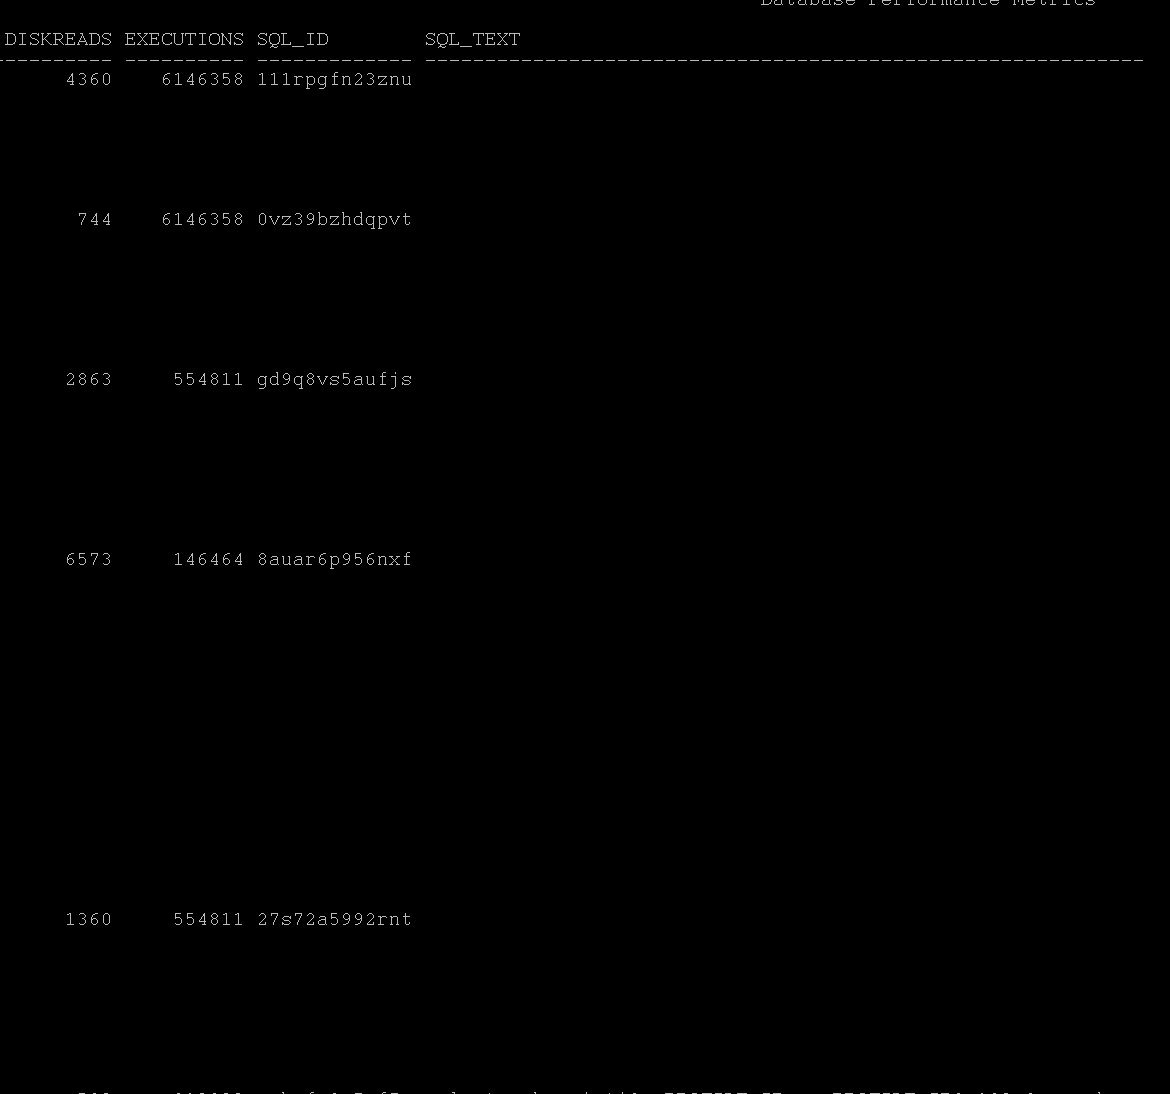
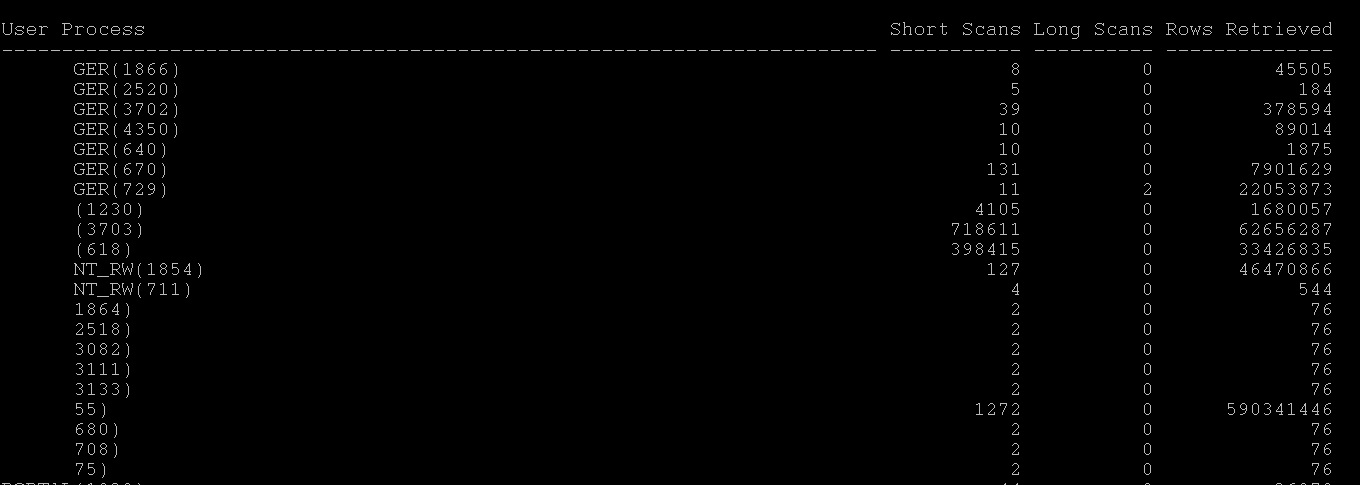
Second identify which object taking more buffer pool usage buffer_pool_top_object.sql
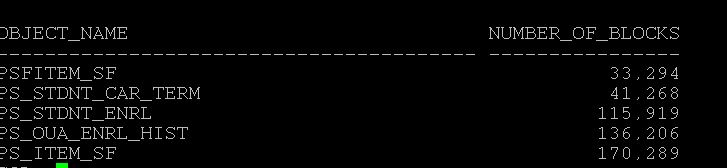
Next, identify those statements which consuming more memory with in buffer pool and check those execution plan, Again if full tablescans happening try to reduce them or may be check the logic or may increase the buffer pool.
SQL> select to_char(last_active_time,'DD-MON HH24:MI'), sql_id,sql_text,executions,rows_processed/executions, disk_reads/executions,buffer_gets/executions from v$sql where sql_text like '%&top_table_above_in_buffer_pool%' order by last_active_time,buffer_gets;
|
|
Hello,
Previous parts in the series we have covered, DB Load Profile, DB Load Profile2, Time Model, IO Performance.
In Today's series, we will see, I cover both current/AWR in one after another below, the scripts are attached and linked for each screenshot for your later use. (It took longer than usual, as such I have to keep lot of screenshot and scripts and note up, please take time to read this long post)
We shall discuss the following in this post,
1. Troubleshoot the high CPU utilization alert (Current)
2. Identifying the high CPU utilization during some time back (AWR)
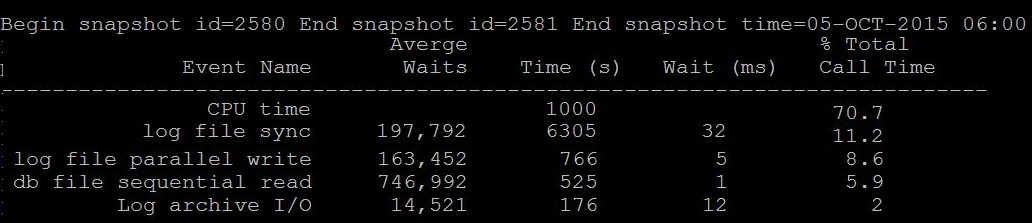
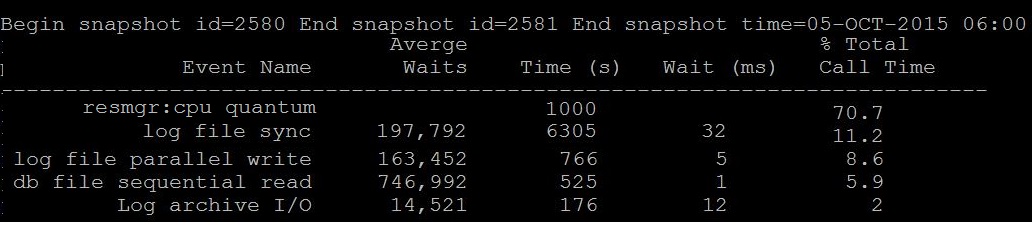
By Looking at below two different snapshot from an hour awr report, What you understand especially about the CPU. (Just sticking to this post "CPU" :))
 |
 |
|
Question: Is CPU Time 70% is waiting or consuming?
Answer: Its consuming, i.e 70% of database time is consuming on CPU only
|
Question: Is resmgr: cpu quantum is waiting or consuming?
Answer: Its waiting, i.e 70% of database time is went to waiting CPU
Note:- Most of the today's oracle database has resource manager active if so the above event can be visible.
|
|
Remember, when you see CPU Time, its time spend on CPU, you will need to
check which statements consuming more CPU.
|
Remember, when you see resmgr: cpu quantum in top its wait event,
its that the sessions waiting to get CPU, so your database is either having less CPU than it should or something running nasty.
|
|
So here, how to know whether this time spent on CPU is good or bad?
The yard stick: Average Active Sessions
If your average active sessions are below the CPU_COUNT, then you still have some other CPU available and database sessions need not to wait for it.
How to find average active sessions that spending time on CPU? AAS can be found from many ways
current_aas.sql (from metrics minutely input no of minutes to check)
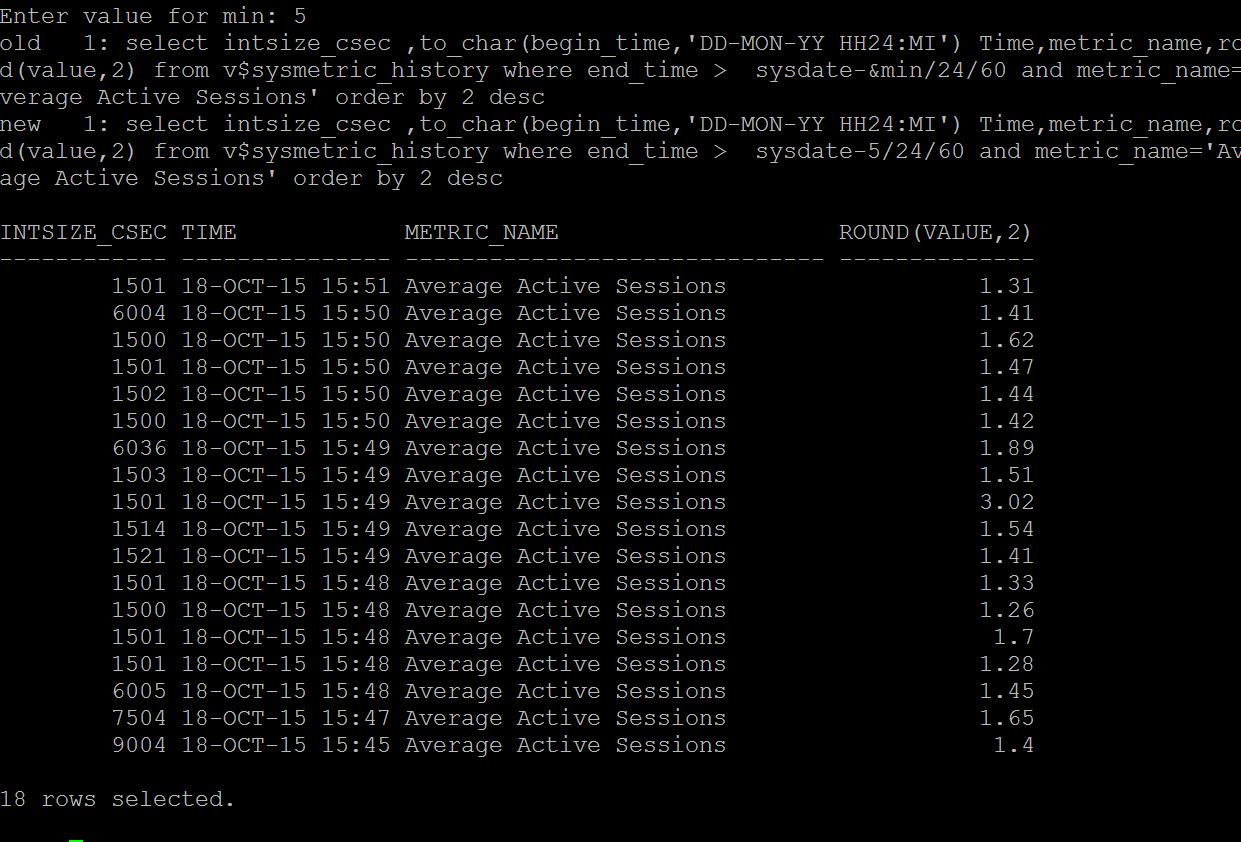
ash_aas.sql (from ash of last two hours by minute)
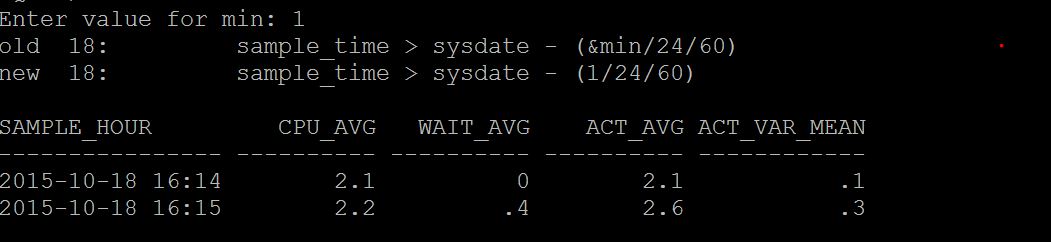
dbash_aas.sql (from dbash more than 2 hours by hourly given days)
As like below screenshot.
awr_aas.sql (from awr from previous snaps by hourly given days)
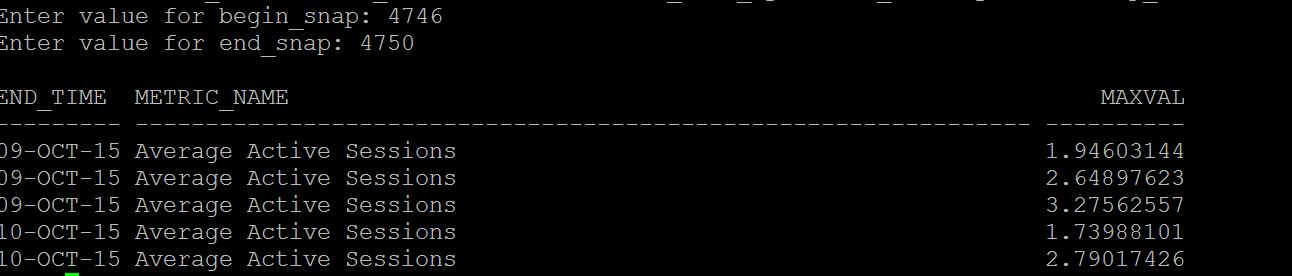
statspack_aas.sql (from statspack by hourly given days)
|
So here, as we evidently know that CPU starvation is happening in the database,
you must check is this one time ? or all snaps or sessions in the database having same event appearing in top/current
How to find the sessions waiting for CPU?
current_cpu_waits.sql (v$session)
ash_cpu_waits.sql (from active session history last 2 hours)
dbash_waits.sql (from dba_active_sess_history more than 2 hours)
awr_cpu_waits.sql (from awr)
statspack_cpu_waits.sql (from statspack)
|
|
Which process is consuming more CPU?
If you have ASH, run ash_top_sessions.sql (Kyle Hailey Script),
As you see the , the sessions that taking more CPU or IO or Waiting is displaying as below
And you can pin point which sessions, which sql_id and so on,
As you see SID 65 is having 4 samples of CPU count in last 1 minute
and 717 having 1 sample of waiting. So sid 65 taking more cpu than others.
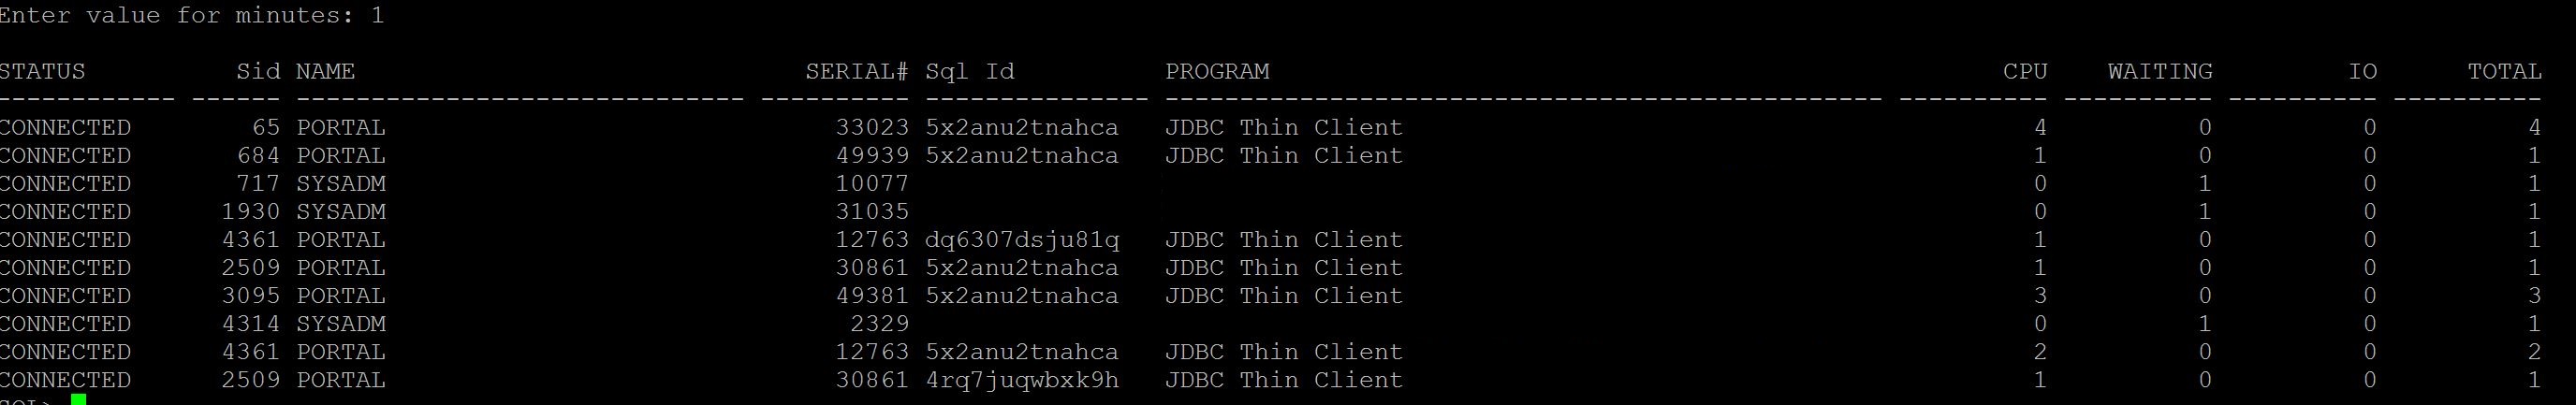
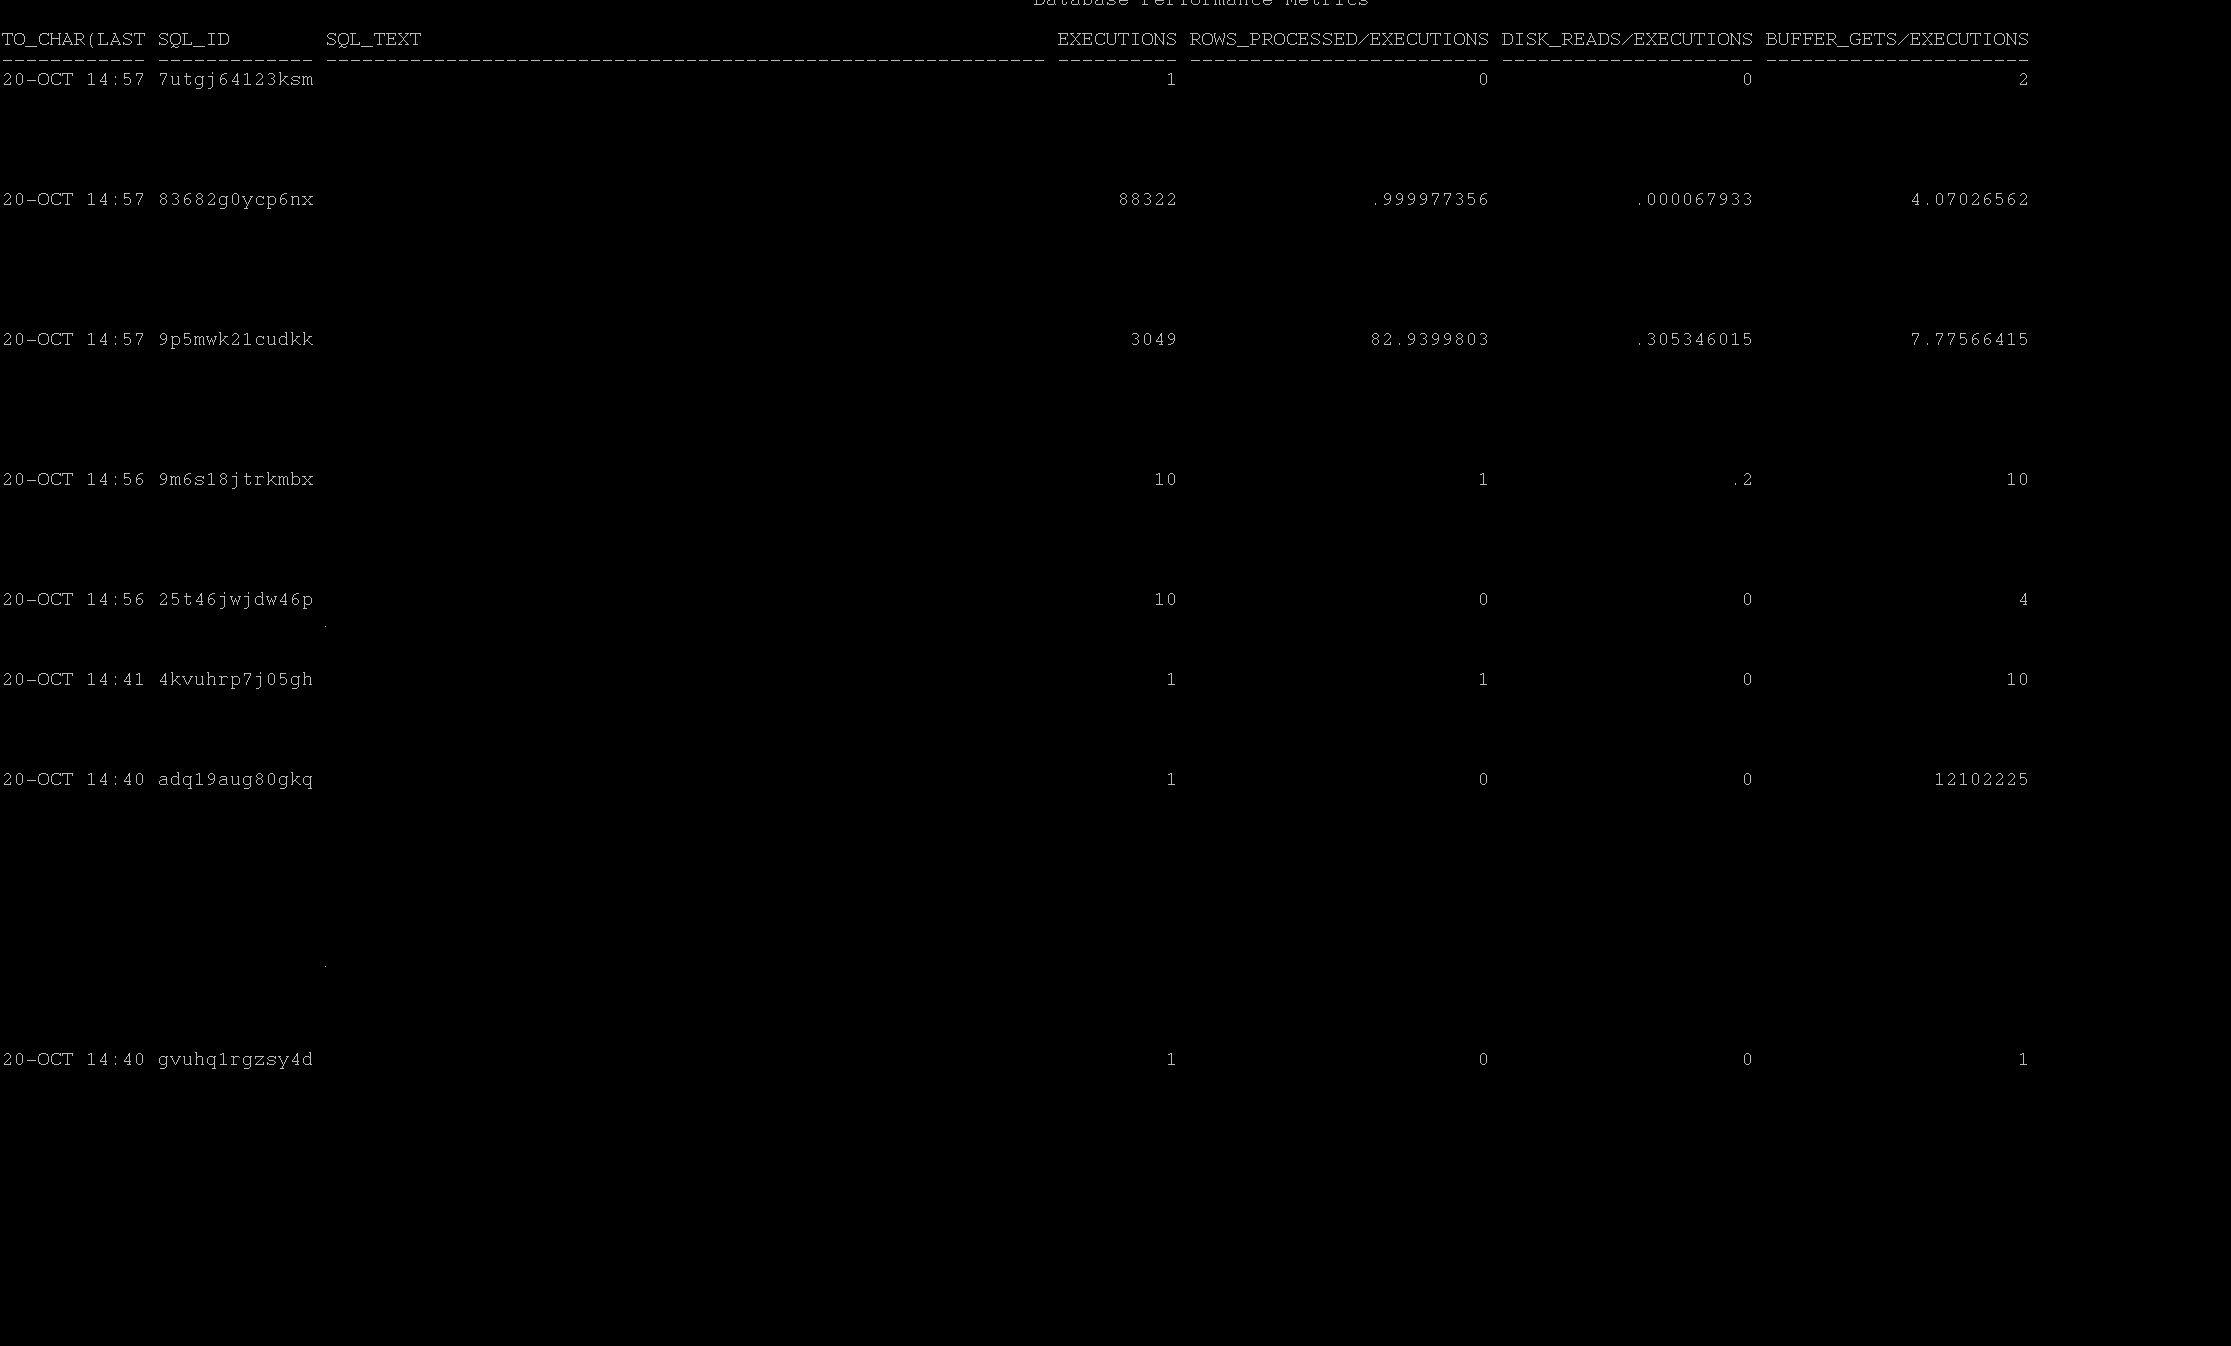
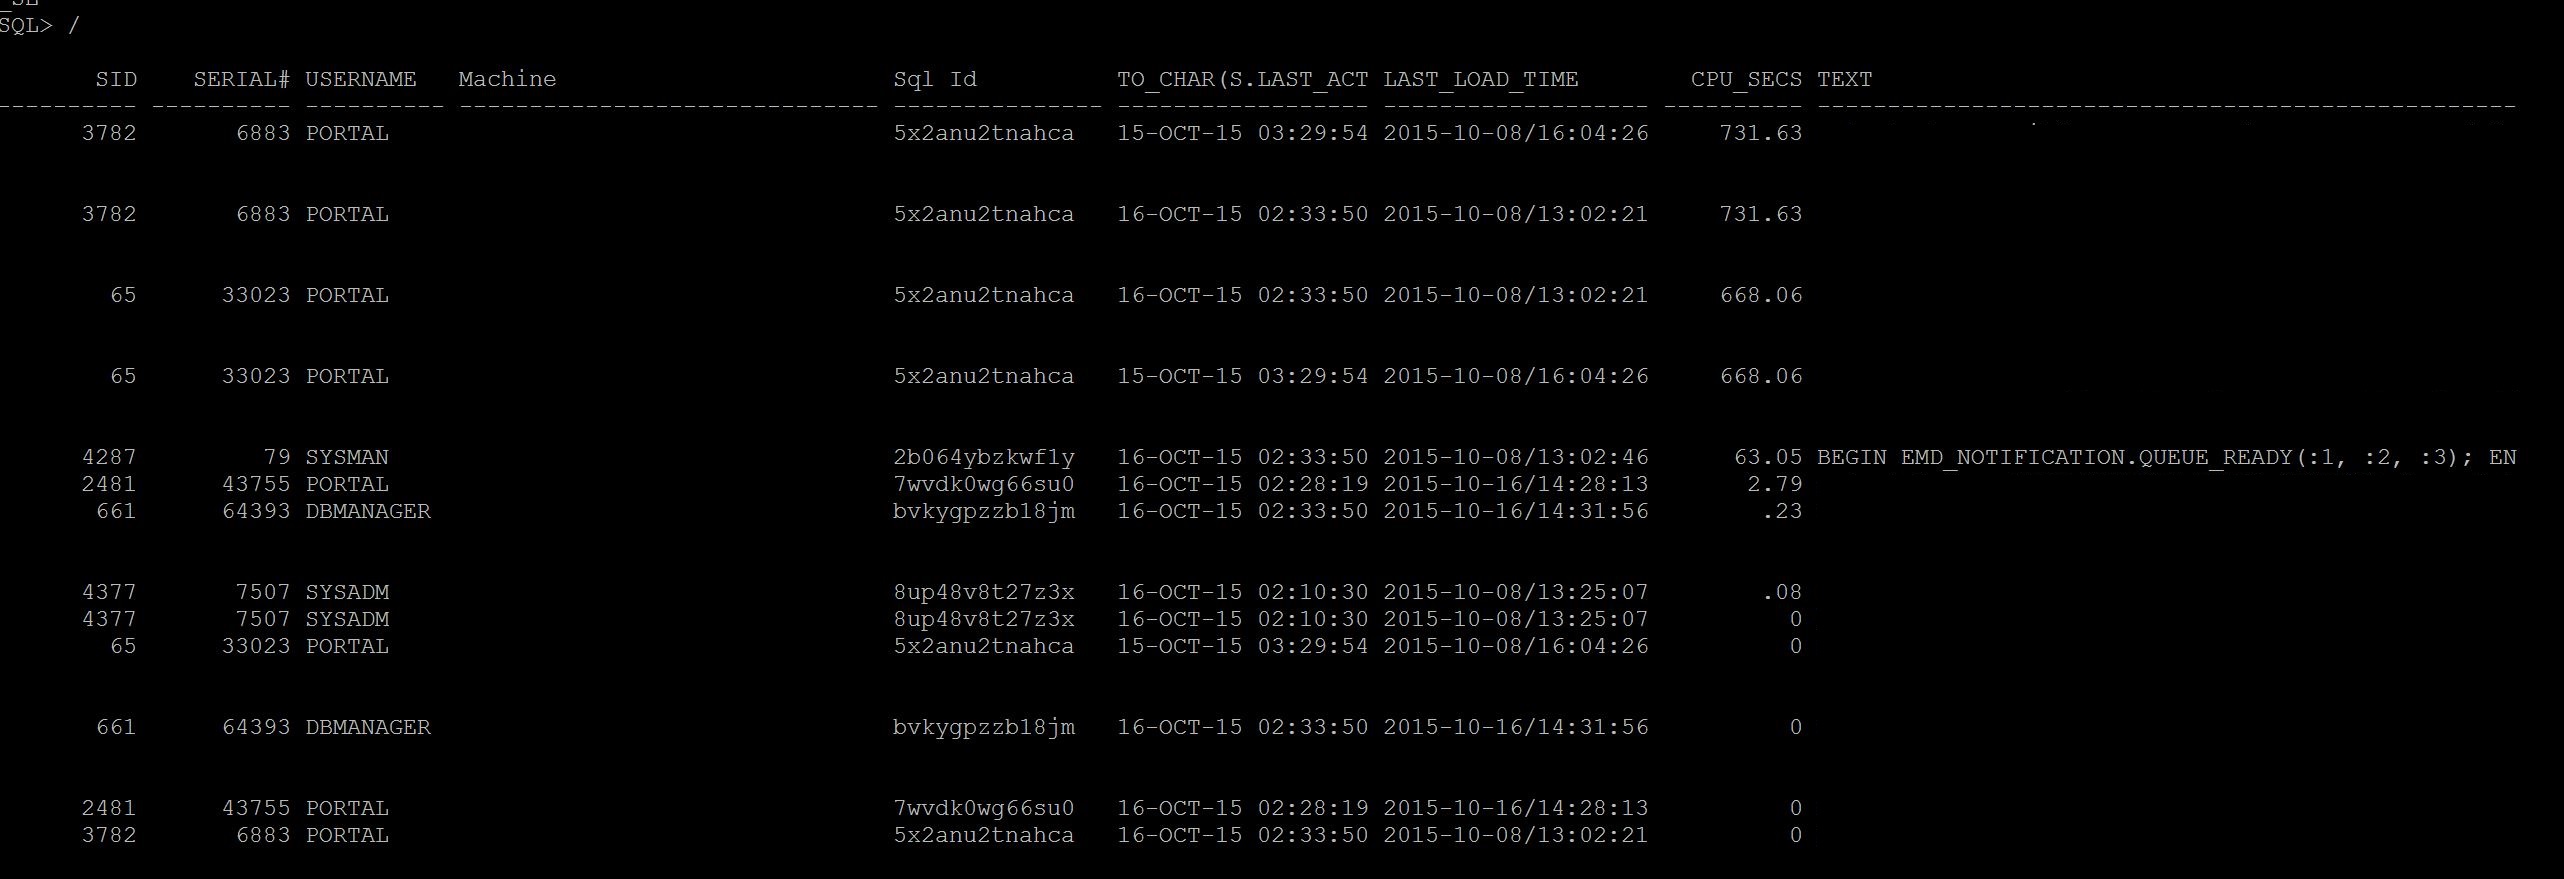
If you do not have ASH, run Current_CPU_Queries.sql or Current_expensive_queries.sql
As you see, the SID 3782 taking more CPU than others and some other sessions, these
are culprit session that consuming more CPU, Wait for sometime and if this sessions
stay long time then its time to check execution plan for it
If you are looking for previous time, run AWR_Top_CPU_Queries.sql and identify the top cpu consuming
statement
For ex: awr_top_cpu.sql 1 2701 2702
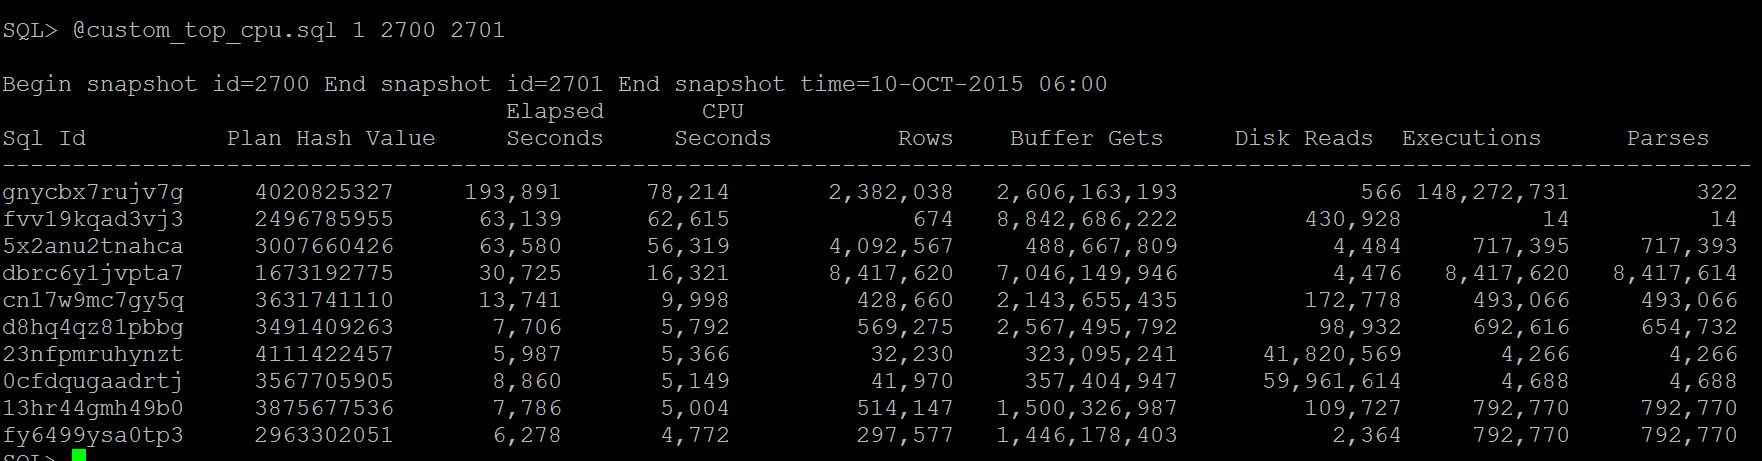
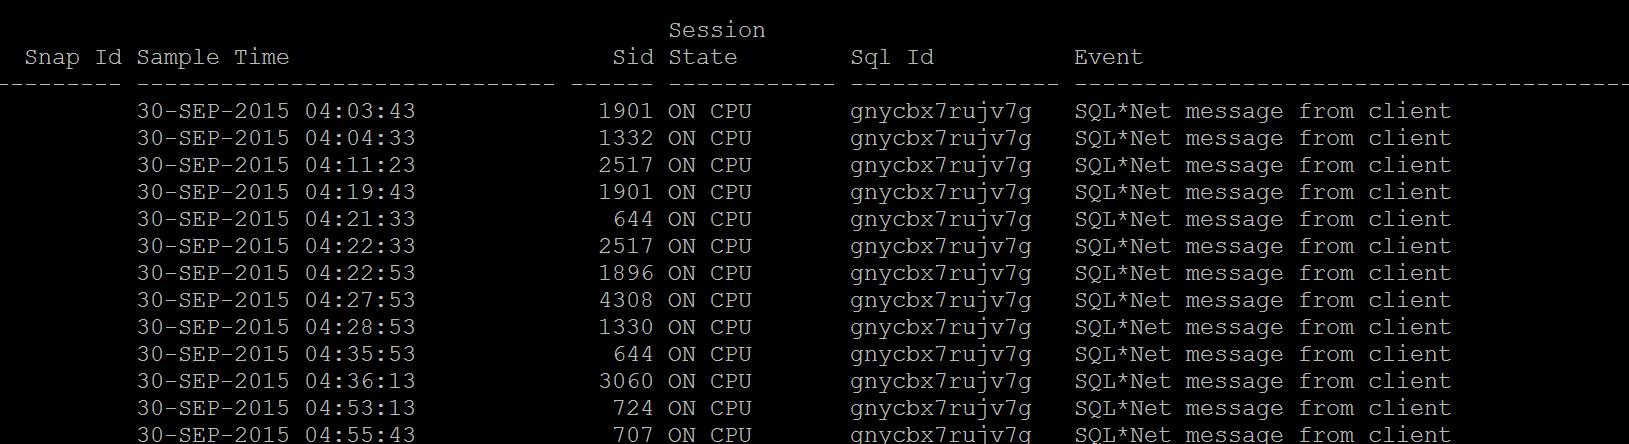
Then run, ash_top_sessions_dash.sql (from dba_hist_active_session_history) to identify which session has
run the top statement sql_id (gnycbx7rujv7g, fvv19kqad3vj3, 5x2anu2tnahca)
For ex: dbsession_for_sqlid.sql
And if you do not have the AWR, run Statspack_CPU_Queries.sql
|
What can cause sessions to wait for CPU?
1. Less CPU's than the database should have. (undersized database)
2. Couple of sessions spinning on CPU for latches and other sessions more waiting for CPU with 'resmgr: cpu quantum' wait event.
Identify them, Which process is consuming is more CPU? (the other column beside this)
1. Current_CPU_Queries.sql
2. ash_top_cpu.sql
3. Statspack_Latch_waits.sql
|
|
Now, you identified the Top CPU utilized statements, its time to understand how this statement performed previously
1. Run awr_sql_run_history.sql and look at two columns especially, PLAN_HASH_VALUE and CPU_COST
this tells you, is there any change in the plan with current plan and cost of CPU.
For awr_sql_run_history.sql 1 sql_id
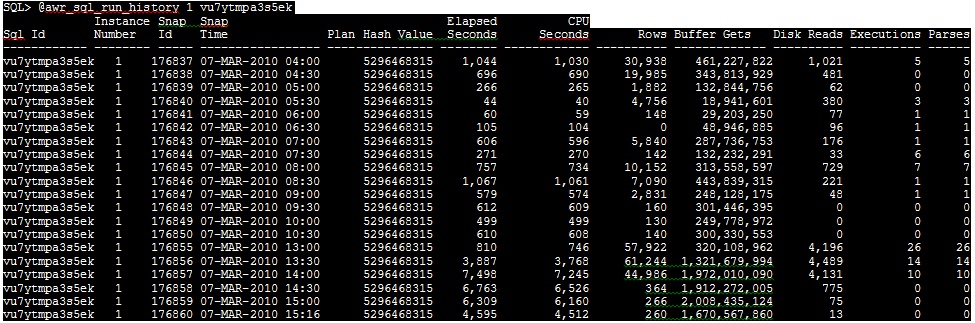
If so cost is higher earlier, this SQL must be tuned or need to be analyze the logic.
If so Plan change has cause the CPU spike for this statement, there must be statistics or optimizer picking up nested loops more.
Solution: Collect stats for those tables in the query and see or logic need to be revisited.
Solution2: If you want a fix permanently, create sql profile for this statement (I will post it series next)
If you don't have AWR, run Statspack_sql_run_history.sql
|
Now you know the CPU starvation is one time, or appearing every time
1. If one time, consider tune the sql statements or reduce concurrency of statements
2. If its appearing all the time, time to scale the database for a better number of CPU
|
|
After identifying the problematic query, you may need to see if there is any change in statement executions,reads,cost etc.
Secondly, change in plan to check plan_hash_value column.
More notes on over consuming CPU queries.
Generally over nested loops, merge join cartesian, more number of hard parses, more invalidations of queries and need to reparse, latching them can cause more CPU utilization.
1. Nested Loops:- Optimizer do nested loops whenever it sees the join with small tables or smaller set of rows to complete as quick as possible, but how does it know it is small tables (or smaller set), Answer Statistics, If statistics given is wrong to optimizer it may tend to do more nested loops instead of hash join, originally the table is big but due to missing stats the table shown to optimizer as small, so correcting statistics may help to reduce the nested loops.
2. More Hard Parses:- Check in v$sql or dba_hist_sqlstat for the sql_id with executions and parse_calls column if both are same that means this statement is reparsing again and again rather reusing in shared pool. Can be any of the following reasons
1. While the statistics running , your statement is also running and causing more invalidations and need to do reparsing again and again.
2. Cursor_sharing = EXACT, (read more here)
3. Table maintenance operations (Alter, Alter index etc) or any DDL on the underlying object causing the statements to reload and reparse again in shared pool.
3. Merge Join Cartesian:- When you see the execution plan with this access path , then it may be cause that either one of the join condition is missing or statistics again causing to see table as 0 rows and actually table has rows. In my observation some time having 0 rows/some rows can lead to this inaccurate access paths especially with staging tables ( not global temporary tables)
4. Latching & Concurrency:- Due to small shared pool more number of sessions waiting to aquire latch and queue is increased, you may see latch:free or latch library cache lock etc in session wait events and this may cause spin on cpu, identifying the root of blocker and kill it may help in this cases. For example a package is executing by many sessions and this has been modified by one sessions can cause more invalidations and locks and latch release/acquire for many sessions at one time.
|
There may be number of ways to identify the similar information and everyone has their own approach and some can be quicker but some can be time taking, the above information is purely for learning purposes and also it has lot of queries appended due to the nature of the issue. It will be good to cover the post in all angles rather sticking to one area like current or past, I tried to put every possible current,past,ash,noash,statspack queries attached where they may be useful to some one who does not have all.
-Hope this helps
Next in Series: Troubleshooting Enqueues (Locks)
Geek DBA
|


Follow Me!!!