Here is the script and snippet of Average Active Sessions plotted by Hour in Oracle database. This is similar to Oracle Log switch history.
This helps DBA to understand the hourly metric of AAS and determine any spikes of the active sessions for the problematic period or gather some particular trend of AAS.
My first check would be this when some one say during particular time the database performance was slow etc etc. AAS helps us to determine how many active sessions were during that period which threshold to CPU count parameter in the database. If the value is less that CPU count means the database still can process if not database is experiencing load and sessions has to wait for CPU calls.
The query takes max value of the metric Average Active Session from DBA_HIST_SYSMETRIC_SUMMARY for last 7 days and plot by hourly using decode.
set linesize 300
col day for a11
col 00 format 999999
col 01 format 999999
col 02 format 999999
col 03 format 999999
col 04 format 999999
col 05 format 999999
col 06 format 999999
col 07 format 999999
col 08 format 999999
col 09 format 999999
col 10 format 999999
col 11 format 999999
col 12 format 999999
col 13 format 999999
col 14 format 999999
col 15 format 999999
col 16 format 999999
col 17 format 999999
col 18 format 999999
col 19 format 999999
col 20 format 999999
col 21 format 999999
col 22 format 999999
col 23 format 999999
select
to_char(begin_time,'DD-MON-YY') Day,
round(max(decode(to_char(begin_time,'HH24'),'00',maxval,NULL)),2) "00",
round(max(decode(to_char(begin_time,'HH24'),'01',maxval,NULL)),2) "01",
round(max(decode(to_char(begin_time,'HH24'),'02',maxval,NULL)),2) "02",
round(max(decode(to_char(begin_time,'HH24'),'03',maxval,NULL)),2) "03",
round(max(decode(to_char(begin_time,'HH24'),'04',maxval,NULL)),2) "04",
round(max(decode(to_char(begin_time,'HH24'),'05',maxval,NULL)),2) "05",
round(max(decode(to_char(begin_time,'HH24'),'06',maxval,NULL)),2) "06",
round(max(decode(to_char(begin_time,'HH24'),'07',maxval,NULL)),2) "07",
round(max(decode(to_char(begin_time,'HH24'),'08',maxval,NULL)),2) "08",
round(max(decode(to_char(begin_time,'HH24'),'09',maxval,NULL)),2) "09",
round(max(decode(to_char(begin_time,'HH24'),'10',maxval,NULL)),2) "10",
round(max(decode(to_char(begin_time,'HH24'),'11',maxval,NULL)),2) "11",
round(max(decode(to_char(begin_time,'HH24'),'12',maxval,NULL)),2) "12",
round(max(decode(to_char(begin_time,'HH24'),'13',maxval,NULL)),2) "13",
round(max(decode(to_char(begin_time,'HH24'),'14',maxval,NULL)),2) "14",
round(max(decode(to_char(begin_time,'HH24'),'15',maxval,NULL)),2) "15",
round(max(decode(to_char(begin_time,'HH24'),'16',maxval,NULL)),2) "16",
round(max(decode(to_char(begin_time,'HH24'),'17',maxval,NULL)),2) "17",
round(max(decode(to_char(begin_time,'HH24'),'18',maxval,NULL)),2) "18",
round(max(decode(to_char(begin_time,'HH24'),'19',maxval,NULL)),2) "19",
round(max(decode(to_char(begin_time,'HH24'),'20',maxval,NULL)),2) "20",
round(max(decode(to_char(begin_time,'HH24'),'21',maxval,NULL)),2) "21",
round(max(decode(to_char(begin_time,'HH24'),'21',maxval,NULL)),2) "22",
round(max(decode(to_char(begin_time,'HH24'),'21',maxval,NULL)),2) "23"
from dba_hist_sysmetric_SUMMARY A where BEGIN_TIME > sysdate - 15
and A.METRIC_NAME in('Average Active Sessions') group by to_char(begin_time,'DD-MON-YY') order by to_char(begin_time,'DD-MON-YY') ;
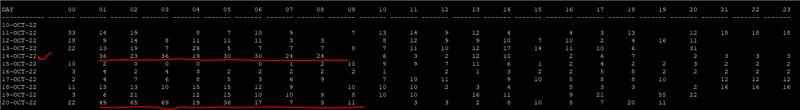
As you see the sessions were spike during 21:00PM to 04:00AM during 14th and 20th dates.
Hope this helps
-GeekDBA
Follow Me!!!