Subscribe to Posts by Email

Subscriber Count

    696

Disclaimer

All information is offered in good faith and in the hope that it may be of use for educational purpose and for Database community purpose, but is not guaranteed to be correct, up to date or suitable for any particular purpose. db.geeksinsight.com accepts no liability in respect of this information or its use. This site is independent of and does not represent Oracle Corporation in any way. Oracle does not officially sponsor, approve, or endorse this site or its content and if notify any such I am happy to remove. Product and company names mentioned in this website may be the trademarks of their respective owners and published here for informational purpose only. This is my personal blog. The views expressed on these pages are mine and learnt from other blogs and bloggers and to enhance and support the DBA community and this web blog does not represent the thoughts, intentions, plans or strategies of my current employer nor the Oracle and its affiliates or any other companies. And this website does not offer or take profit for providing these content and this is purely non-profit and for educational purpose only. If you see any issues with Content and copy write issues, I am happy to remove if you notify me. Contact Geek DBA Team, via geeksinsights@gmail.com

Pages

Performance Troubleshooting Series : Understanding where the database time is spending – Time Model Statistics

Hello,

This is the third post in this series, If you haven't read the previous articles please go through here,

First Post, http://db.geeksinsight.com/2015/10/08/performance-troubleshooting-series-understanding-your-oracle-database-load/

Second Post, http://db.geeksinsight.com/2015/10/09/performance-troubleshooting-series-understanding-your-database-load-from-metrics-part-2/

Starting 10g, Apart from Metrics tables, there is another area of troubleshooting can be done by using Time Model series. Its very useful to understand where is the over all time in the database that is spending using following tables.

Download For Current Using  v$sys_time_model :  Current_time_model.sql

Download From AWR using dba_hist_sys_time_model: awr_time_model.sql

Download From Statspack using stats$sys_time_model and stats$sys_time_model_name :  statspack_time_model.sql

Example Report:- 

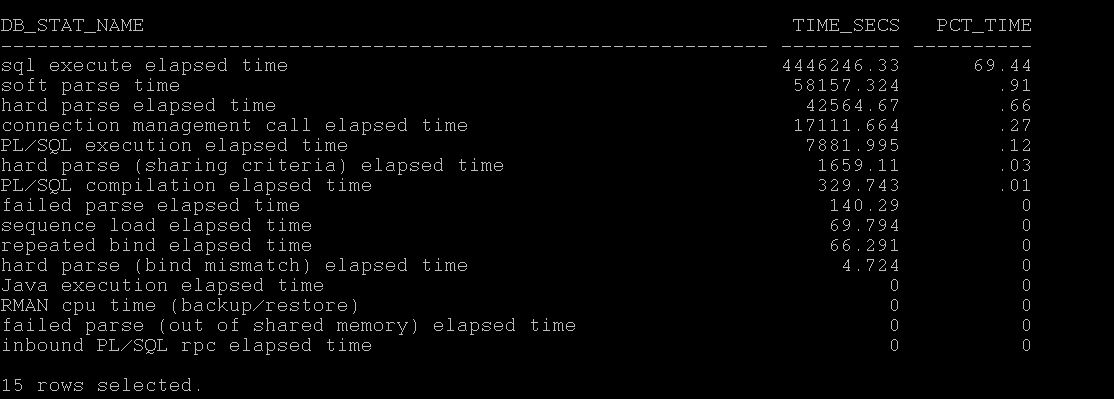
As you see above, the database in the question takes 69% of total time spent in executing SQL.

If you see, CPU or DB CPU that means Database has spent most of the time in processing on CPU.

If you see, hard parse elapsed time, then it means , most of the spending in hard parses.

If you see, RMAN spending on CPU in large percentages

If you see, Connection management call elapsed time, you may worth checking the no. of connection, network latencies etc.

So in this way you can understand with time model series where the most of the database time is spending.

The following action would be checking which statements are running long, doing lot of parses, or CPU related statements etc. (Long road ahead to write those)

Next in the Series, Understanding I/O Profile and I/O Latencies.

-Thanks

Geek DBA

Comments are closed.