Hello,
Previous parts in the series we have covered, DB Load Profile, DB Load Profile2, Time Model, IO Performance.
In Today's series, we will see, I cover both current/AWR in one after another below, the scripts are attached and linked for each screenshot for your later use. (It took longer than usual, as such I have to keep lot of screenshot and scripts and note up, please take time to read this long post)
We shall discuss the following in this post,
1. Troubleshoot the high CPU utilization alert (Current)
2. Identifying the high CPU utilization during some time back (AWR)
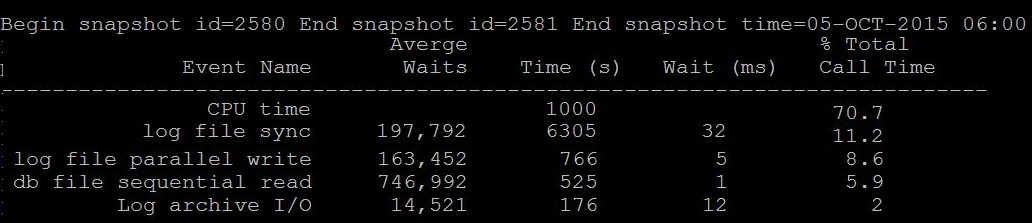
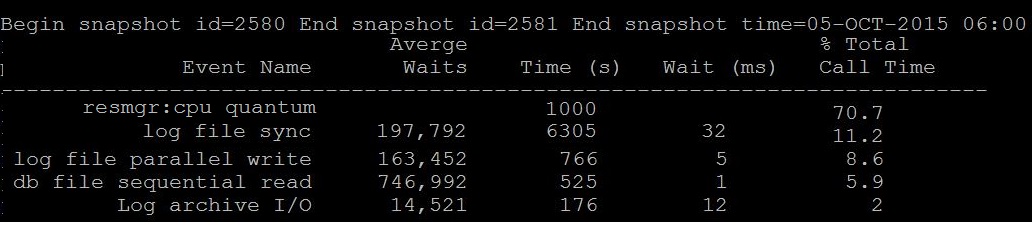
By Looking at below two different snapshot from an hour awr report, What you understand especially about the CPU. (Just sticking to this post "CPU" :))
 |
 |
|
Question: Is CPU Time 70% is waiting or consuming? Answer: Its consuming, i.e 70% of database time is consuming on CPU only |
Question: Is resmgr: cpu quantum is waiting or consuming? Answer: Its waiting, i.e 70% of database time is went to waiting CPU Note:- Most of the today's oracle database has resource manager active if so the above event can be visible. |
|
Remember, when you see CPU Time, its time spend on CPU, you will need to check which statements consuming more CPU. |
Remember, when you see resmgr: cpu quantum in top its wait event, its that the sessions waiting to get CPU, so your database is either having less CPU than it should or something running nasty. |
|
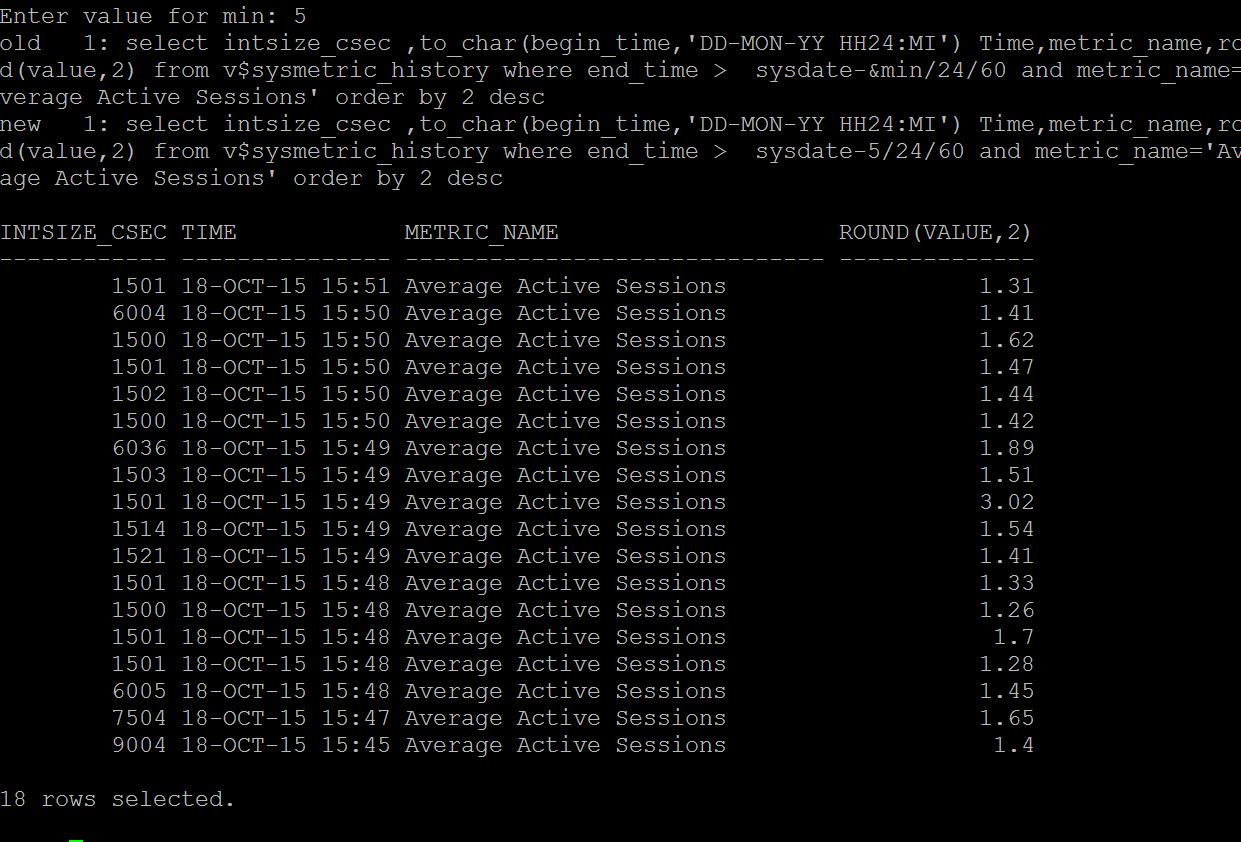
So here, how to know whether this time spent on CPU is good or bad? The yard stick: Average Active Sessions If your average active sessions are below the CPU_COUNT, then you still have some other CPU available and database sessions need not to wait for it. How to find average active sessions that spending time on CPU? AAS can be found from many ways current_aas.sql (from metrics minutely input no of minutes to check)
ash_aas.sql (from ash of last two hours by minute)
dbash_aas.sql (from dbash more than 2 hours by hourly given days) As like below screenshot. awr_aas.sql (from awr from previous snaps by hourly given days)
statspack_aas.sql (from statspack by hourly given days) |
So here, as we evidently know that CPU starvation is happening in the database, you must check is this one time ? or all snaps or sessions in the database having same event appearing in top/current How to find the sessions waiting for CPU? current_cpu_waits.sql (v$session) ash_cpu_waits.sql (from active session history last 2 hours) dbash_waits.sql (from dba_active_sess_history more than 2 hours) awr_cpu_waits.sql (from awr) statspack_cpu_waits.sql (from statspack) |
|
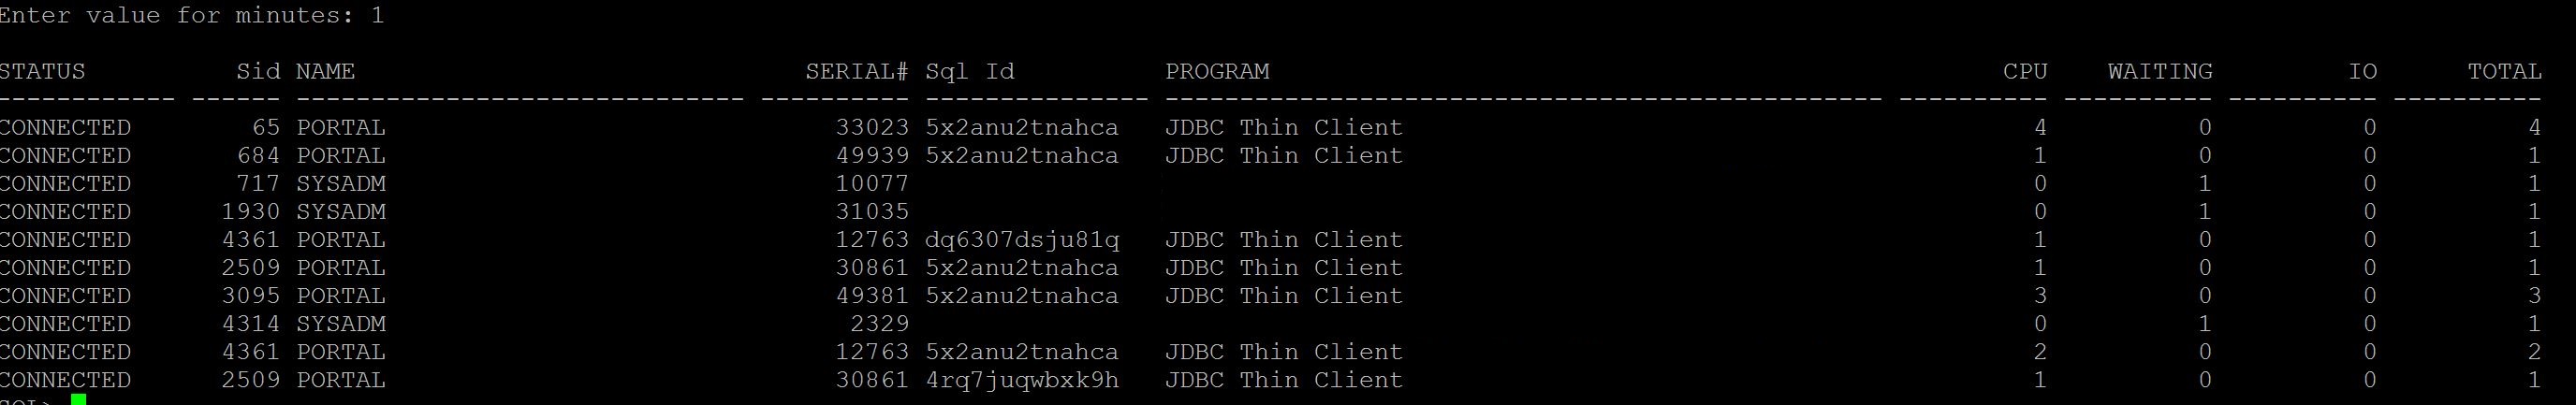
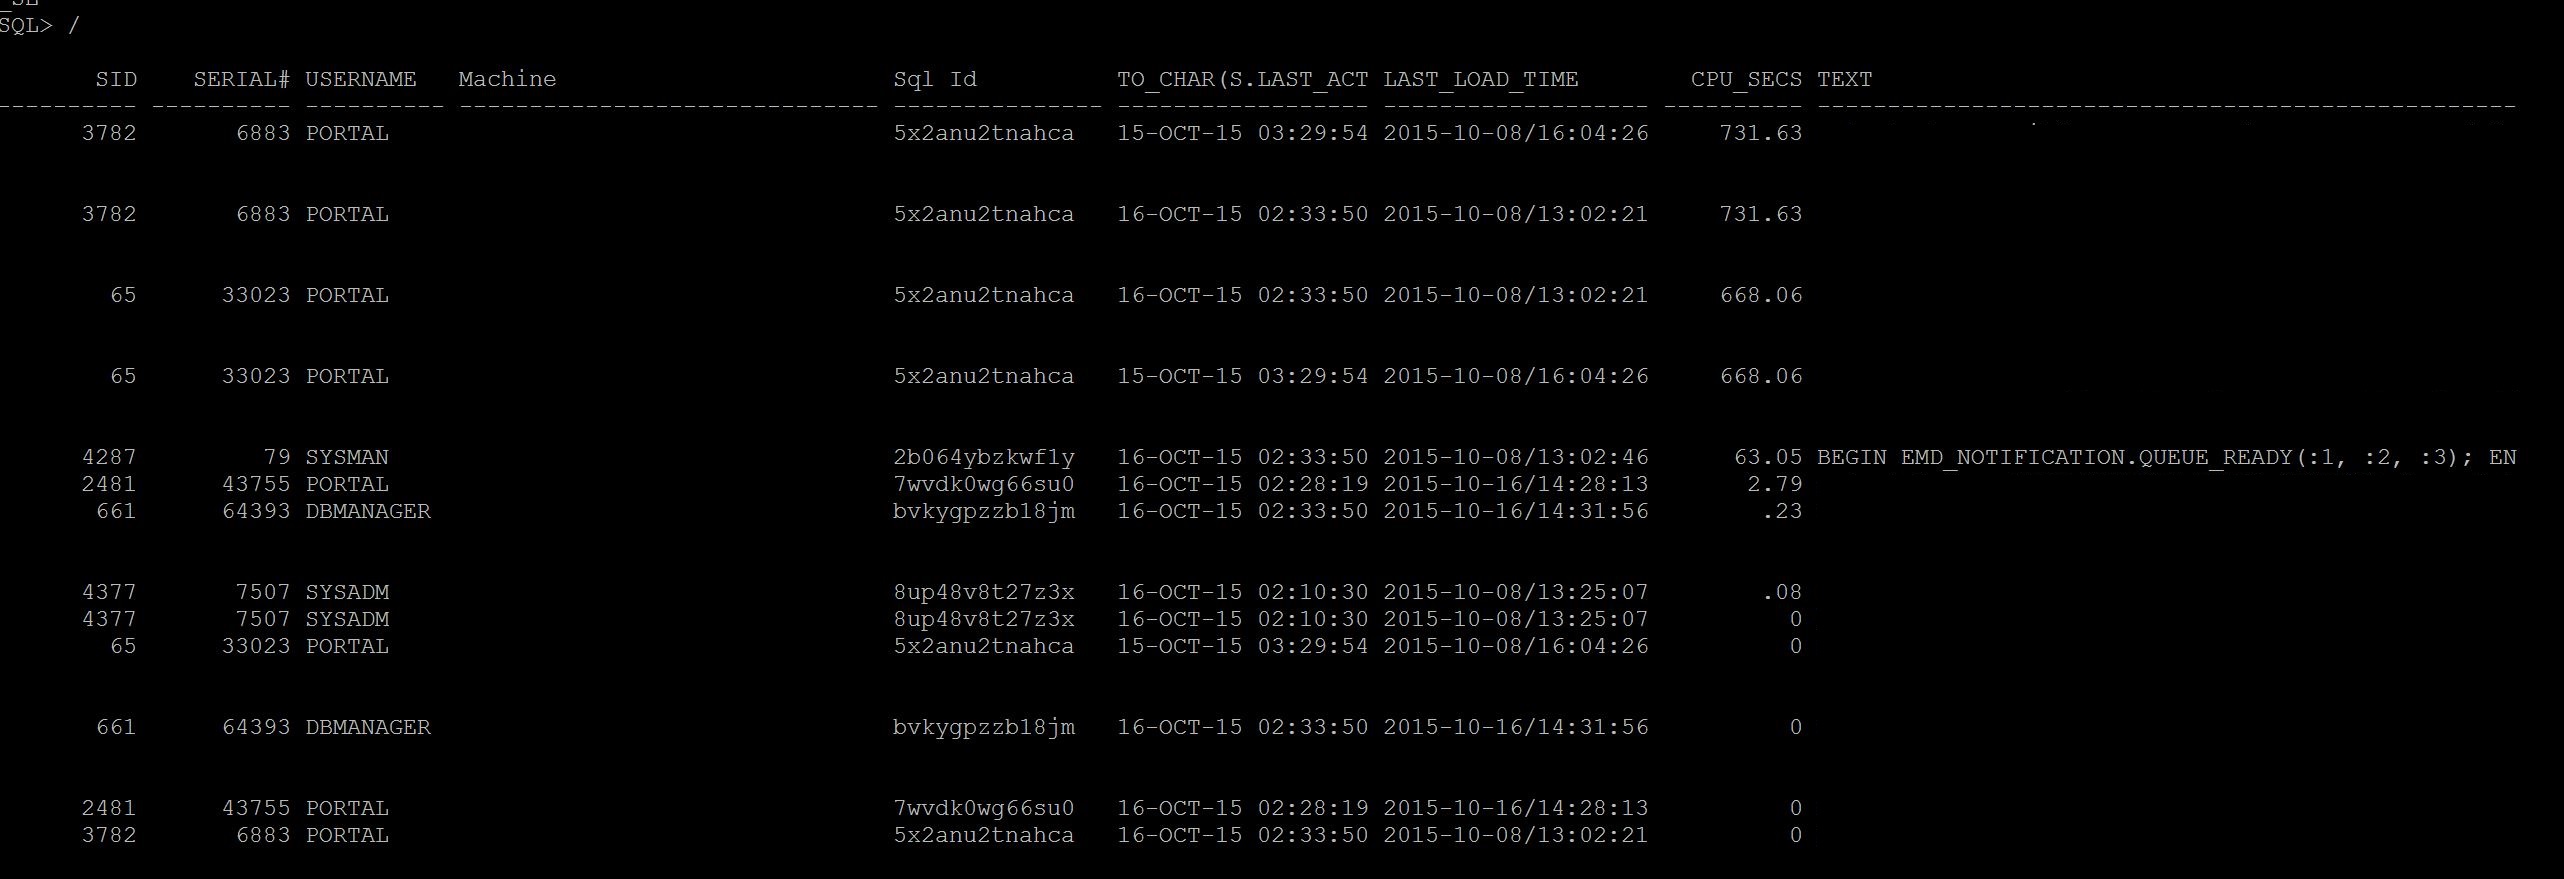
Which process is consuming more CPU? If you have ASH, run ash_top_sessions.sql (Kyle Hailey Script), As you see the , the sessions that taking more CPU or IO or Waiting is displaying as below And you can pin point which sessions, which sql_id and so on, As you see SID 65 is having 4 samples of CPU count in last 1 minute and 717 having 1 sample of waiting. So sid 65 taking more cpu than others. If you do not have ASH, run Current_CPU_Queries.sql or Current_expensive_queries.sql As you see, the SID 3782 taking more CPU than others and some other sessions, these are culprit session that consuming more CPU, Wait for sometime and if this sessions stay long time then its time to check execution plan for it
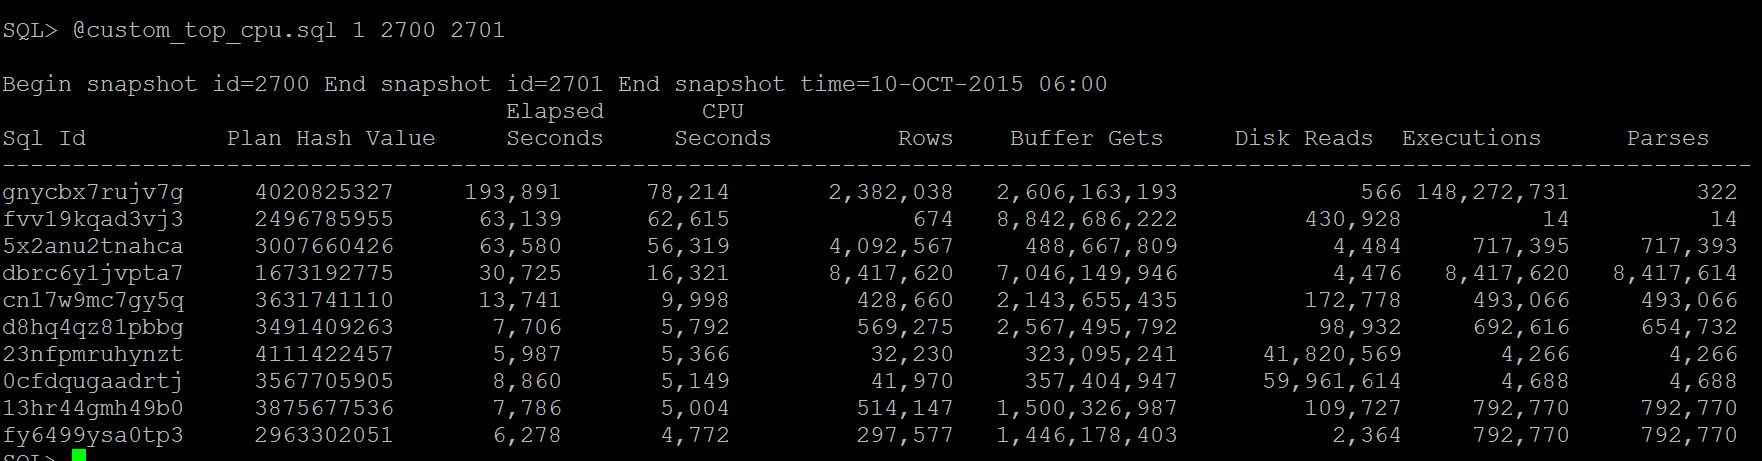
If you are looking for previous time, run AWR_Top_CPU_Queries.sql and identify the top cpu consuming statement For ex: awr_top_cpu.sql 1 2701 2702
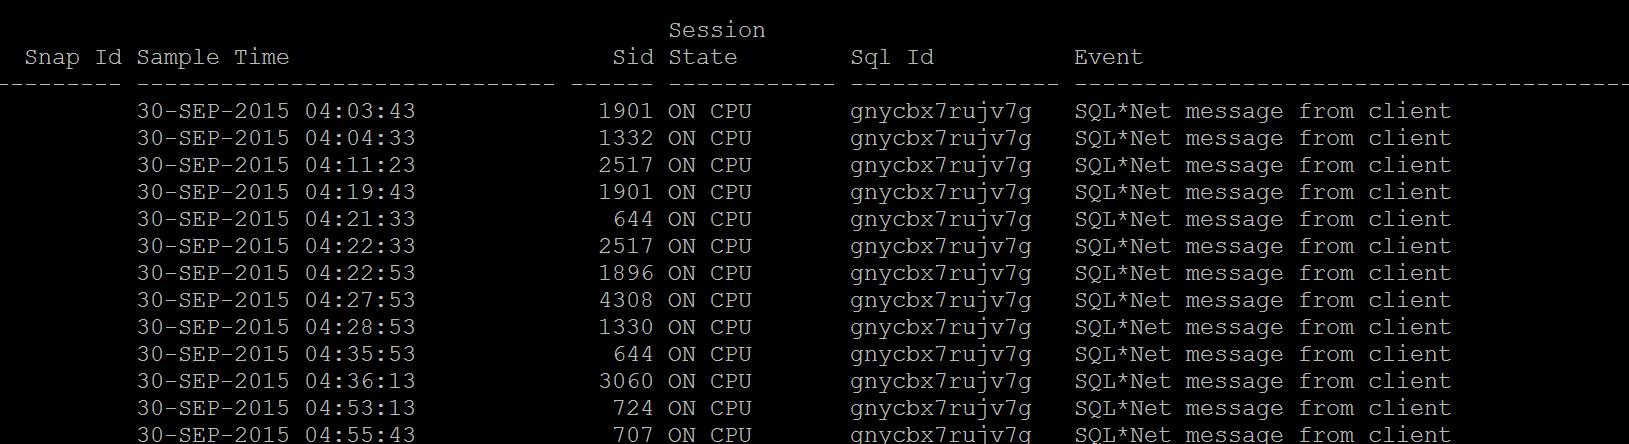
Then run, ash_top_sessions_dash.sql (from dba_hist_active_session_history) to identify which session has run the top statement sql_id (gnycbx7rujv7g, fvv19kqad3vj3, 5x2anu2tnahca) For ex: dbsession_for_sqlid.sql
And if you do not have the AWR, run Statspack_CPU_Queries.sql |
What can cause sessions to wait for CPU? 1. Less CPU's than the database should have. (undersized database) 2. Couple of sessions spinning on CPU for latches and other sessions more waiting for CPU with 'resmgr: cpu quantum' wait event. Identify them, Which process is consuming is more CPU? (the other column beside this) 1. Current_CPU_Queries.sql 2. ash_top_cpu.sql 3. Statspack_Latch_waits.sql
|
|
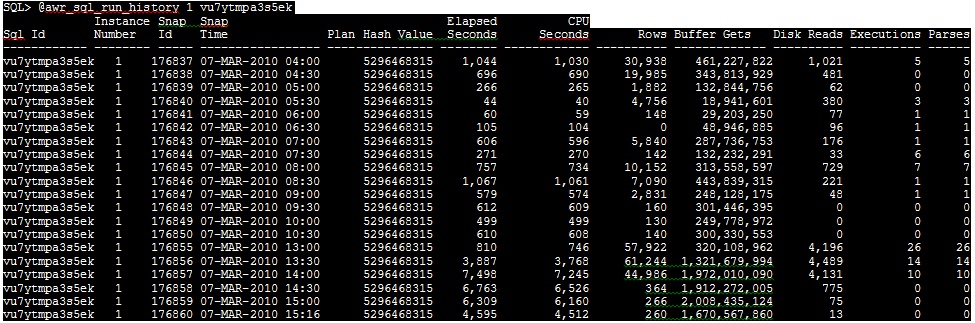
Now, you identified the Top CPU utilized statements, its time to understand how this statement performed previously 1. Run awr_sql_run_history.sql and look at two columns especially, PLAN_HASH_VALUE and CPU_COST this tells you, is there any change in the plan with current plan and cost of CPU. For awr_sql_run_history.sql 1 sql_id
If so cost is higher earlier, this SQL must be tuned or need to be analyze the logic. If so Plan change has cause the CPU spike for this statement, there must be statistics or optimizer picking up nested loops more.
Solution: Collect stats for those tables in the query and see or logic need to be revisited. Solution2: If you want a fix permanently, create sql profile for this statement (I will post it series next)
If you don't have AWR, run Statspack_sql_run_history.sql |
Now you know the CPU starvation is one time, or appearing every time 1. If one time, consider tune the sql statements or reduce concurrency of statements 2. If its appearing all the time, time to scale the database for a better number of CPU |
|
After identifying the problematic query, you may need to see if there is any change in statement executions,reads,cost etc. Secondly, change in plan to check plan_hash_value column. More notes on over consuming CPU queries. Generally over nested loops, merge join cartesian, more number of hard parses, more invalidations of queries and need to reparse, latching them can cause more CPU utilization. 1. Nested Loops:- Optimizer do nested loops whenever it sees the join with small tables or smaller set of rows to complete as quick as possible, but how does it know it is small tables (or smaller set), Answer Statistics, If statistics given is wrong to optimizer it may tend to do more nested loops instead of hash join, originally the table is big but due to missing stats the table shown to optimizer as small, so correcting statistics may help to reduce the nested loops.
2. More Hard Parses:- Check in v$sql or dba_hist_sqlstat for the sql_id with executions and parse_calls column if both are same that means this statement is reparsing again and again rather reusing in shared pool. Can be any of the following reasons 1. While the statistics running , your statement is also running and causing more invalidations and need to do reparsing again and again. 2. Cursor_sharing = EXACT, (read more here) 3. Table maintenance operations (Alter, Alter index etc) or any DDL on the underlying object causing the statements to reload and reparse again in shared pool. 3. Merge Join Cartesian:- When you see the execution plan with this access path , then it may be cause that either one of the join condition is missing or statistics again causing to see table as 0 rows and actually table has rows. In my observation some time having 0 rows/some rows can lead to this inaccurate access paths especially with staging tables ( not global temporary tables)
4. Latching & Concurrency:- Due to small shared pool more number of sessions waiting to aquire latch and queue is increased, you may see latch:free or latch library cache lock etc in session wait events and this may cause spin on cpu, identifying the root of blocker and kill it may help in this cases. For example a package is executing by many sessions and this has been modified by one sessions can cause more invalidations and locks and latch release/acquire for many sessions at one time. |
|
There may be number of ways to identify the similar information and everyone has their own approach and some can be quicker but some can be time taking, the above information is purely for learning purposes and also it has lot of queries appended due to the nature of the issue. It will be good to cover the post in all angles rather sticking to one area like current or past, I tried to put every possible current,past,ash,noash,statspack queries attached where they may be useful to some one who does not have all.
-Hope this helps
Next in Series: Troubleshooting Enqueues (Locks)
Geek DBA
[…] the previous series we have seen how to troubleshoot IO, CPU and Database […]
Awesome explanation and knowledge shared.
regards
Prasen
Excellent post and good information and scripts. Thank you!
Krishna.
[…] Solution:- Read here and and identify the CPU consuming processes and take appropriate […]