Want to know new features in 12c, 18c, 19c, 20c ??? Follow this
More than 100+ features listed here : http://db.geeksinsight.com/category/12c-database/
More than 50+ features listed here: http://db.geeksinsight.com/category/18c-database/
More than 40 features listed here: http://db.geeksinsight.com/category/19c-database/
Upcoming 20c features : http://db.geeksinsight.com/category/20c-database/
Hello,
After Looking at identifying Database Load in previous posts (Post 1,Post 2) and seeing where the database time spending much (Post 3). Its time to check out how I/O is performance how much average millseconds for each type of I/O wait happening.
Here we are going to discuss about two cases,
1. Case 1: Current I/O Waits and its average wait in milliseconds
2. Historical I/O Waits and its average wait in milliseconds
Please note, I/O performance and its waits depends on lot of factors , disk sizing, rotational speed, vendor specific standard etc. Where in the usual disk I/O latency i.e wait can be upto 20 ms as industry standard. So just for quick understanding even though we have large number of I/O spikes , is database performing good in terms of I/O waits we can measure easily by using following queries in the line.
Case 1:- You have been asked to verify the I/O spikes from database at present/current.
Step1:- Run the current_io_profile.sql which will show you the following and its latency. As told the total sum of all I/O is if not more than 20ms then it is good if not you will need to further dig out which sql/user performing more disk reads etc.
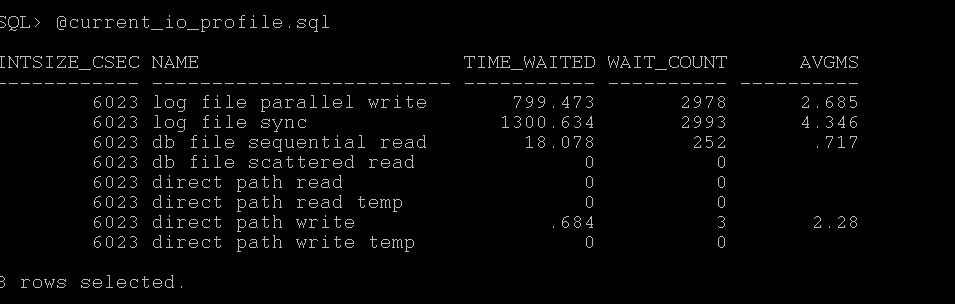
As you see the attached screenshot represents close to 7ms of avg waits for all I/O waits, so it may be okay.
Step2:- Further you can check at OS level using this post, http://db.geeksinsight.com/2013/02/01/unix-finding-high-io-waiting-process-in-linux/
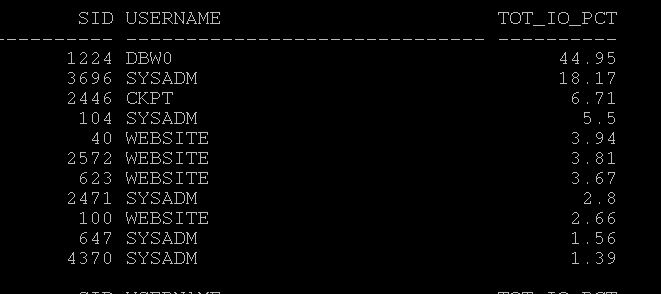
Step3:- Find which sessions that consuming high I/O, Run the current_top_io_consumer.sql and find the session causing it. Here in my case dbw0 causing more I/O.
Step4:- Find which statements causing high I/O, run current_high_reads.sql and see one of the statement caused many reads.
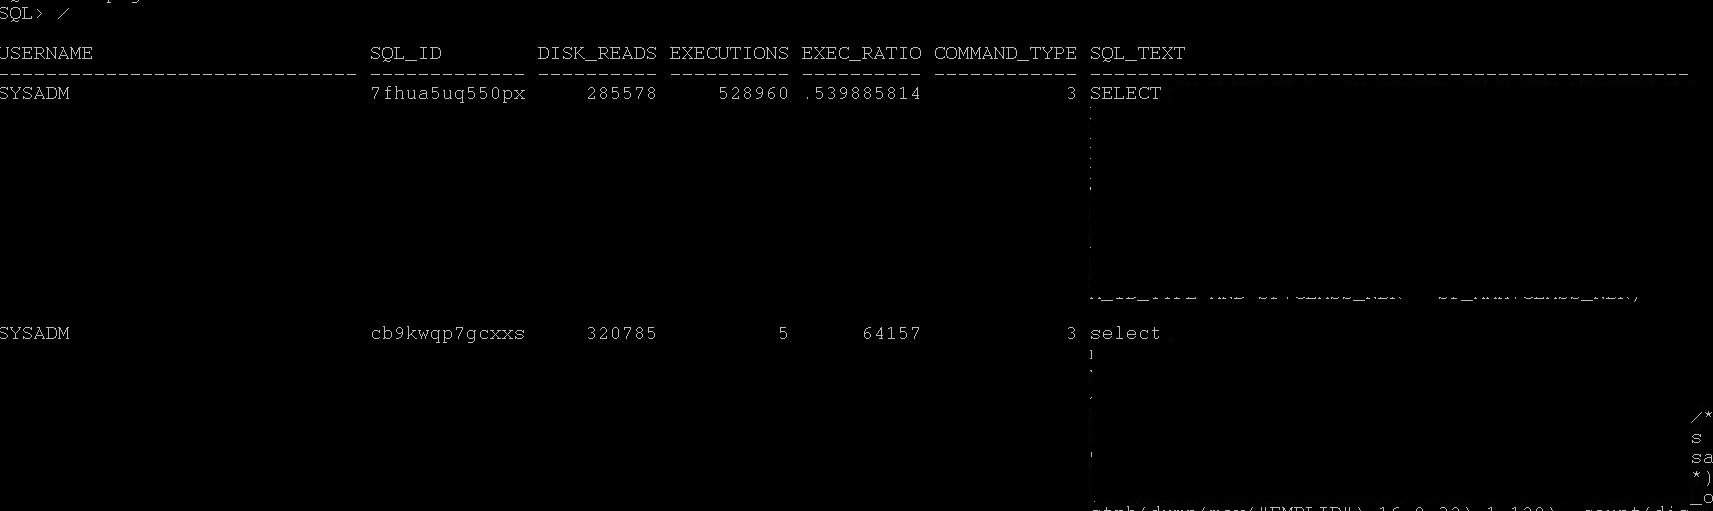
Step5: You may need to check what this SQL execution plan is any full tables happening, if so check for statistics etc.
select * from table(dbms_xplan.display_cursor('7fhua5uq550px'));
Step6:- Worth to understand how this sql performed previously and is there any change in number of executions and previous or any increase in volume of data caused more issues,, or whether optimizer is picking up wrong index etc.
Case 2:- You have been told to verify is there any I/O Spikes during some time back.
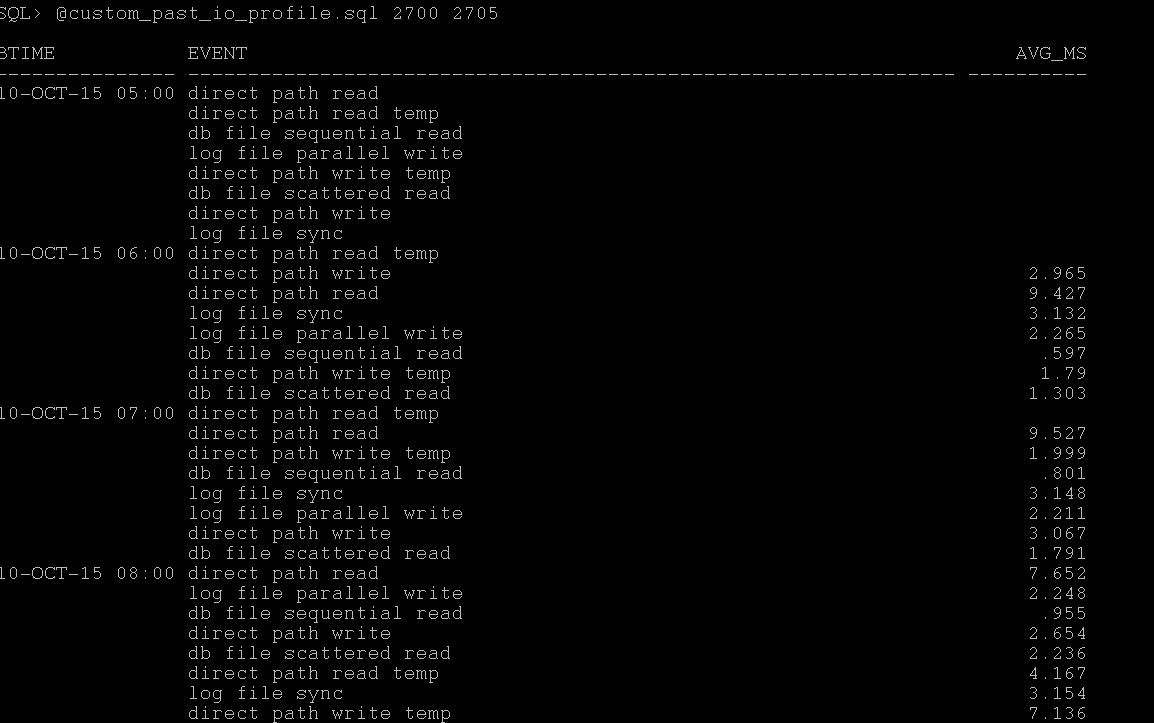
Step1:- Based on timings given, the snap ID's are 2700 and 2702 and running the awr_io_profile.sql (statspack_io_profile.sql) produce the following report which give you idea during which snap it has issue and again 20ms is base line you can check for all wait avg ms if its more than that you may encountering the issue.
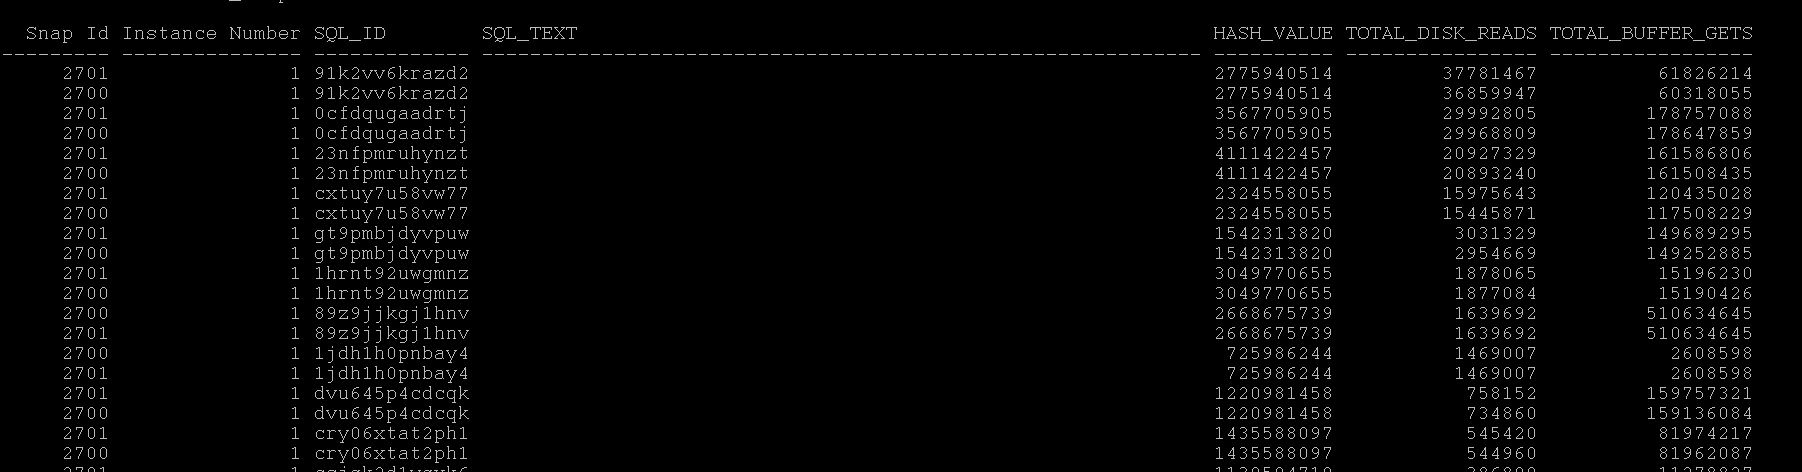
Step 2:- Find which statements caused high reads during that period by running awr_high_reads.sql (statspack_high_reads.sql), for that snap_id you can get which statements having much disk reads etc.
Step 3:- You can then run what is the execution plan for the given top sql id from awr,
select * from table(dbms_xplan.display_awr('91k2vv6krazd2'));
Step 4:- Now as with execution plan you can see where most of the rows coming and check what is the issue with high reads and reduce the reads by keeping index or collecting stats or rebuilding indexes so that optimizer may pickup index as it depends on what exact you have the situation is.
Note:- There are number of ways you can find this information with different tables and the approach may be different than mine, ultimately we should be able to identify the root cause of issue and fix accordingly
Next in Series:- Understanding CPU Utilization & Top Consumers
Hope this helps you!!!
Geek DBA
[…] Previous parts in the series we have covered, DB Load Profile, DB Load Profile2, Time Model, IO Performance. […]
[…] the previous series we have seen how to troubleshoot IO, CPU and Database […]
Just awesome ….. No one has till date being able to give such a fantastic explanation with scripts and with screenshots…keep it up …thanks again.
Just a request ….if u can make the series in pdf format then it would be much appreciated
Hi Hemal
Thanks, Once I complete I will publish as pdf. Will keep it in todo.
-Thanks
Geek DBA
execellent
Nice post !!! could you please provide awr_io_profile.sql
The query is giving error;
SQL> SELECT t2.username,t1.sql_id ,t1.disk_reads_total, t1.executions_total,
2 t1.disk_reads_total / DECODE(t1.executions_total, 0, 1, t1.executions_total) as exec_ratio
FROM dba_hist_sqlstat t1, dba_users t2
WHERE t1.parsing_user_id = t2.user_id
AND t.snap_id between &Begin_Snap and &End_Snap
3 4 5 6 ORDER BY snap_id,t1.disk_reads_total;
Enter value for begin_snap: 104739
Enter value for end_snap: 104759
old 5: AND t.snap_id between &Begin_Snap and &End_Snap
new 5: AND t.snap_id between 104739 and 104759
AND t.snap_id between 104739 and 104759
*
ERROR at line 5:
ORA-00904: “T”.”SNAP_ID”: invalid identifier