Disclaimer All information is offered in good faith and in the hope that it may be of use for educational purpose and for Database community purpose, but is not guaranteed to be correct, up to date or suitable for any particular purpose. db.geeksinsight.com accepts no liability in respect of this information or its use.
This site is independent of and does not represent Oracle Corporation in any way. Oracle does not officially sponsor, approve, or endorse this site or its content and if notify any such I am happy to remove.
Product and company names mentioned in this website may be the trademarks of their respective owners and published here for informational purpose only.
This is my personal blog. The views expressed on these pages are mine and learnt from other blogs and bloggers and to enhance and support the DBA community and this web blog does not represent the thoughts, intentions, plans or strategies of my current employer nor the Oracle and its affiliates or any other companies. And this website does not offer or take profit for providing these content and this is purely non-profit and for educational purpose only.
If you see any issues with Content and copy write issues, I am happy to remove if you notify me.
Contact Geek DBA Team, via geeksinsights@gmail.com
|
Want to know new features in 12c, 18c, 19c, 20c ??? Follow this
More than 100+ features listed here : http://db.geeksinsight.com/category/12c-database/
More than 50+ features listed here: http://db.geeksinsight.com/category/18c-database/
More than 40 features listed here: http://db.geeksinsight.com/category/19c-database/
Upcoming 20c features : http://db.geeksinsight.com/category/20c-database/
Hello,
After Looking at identifying Database Load in previous posts (Post 1,Post 2) and seeing where the database time spending much (Post 3). Its time to check out how I/O is performance how much average millseconds for each type of I/O wait happening.
Here we are going to discuss about two cases,
1. Case 1: Current I/O Waits and its average wait in milliseconds
2. Historical I/O Waits and its average wait in milliseconds
Please note, I/O performance and its waits depends on lot of factors , disk sizing, rotational speed, vendor specific standard etc. Where in the usual disk I/O latency i.e wait can be upto 20 ms as industry standard. So just for quick understanding even though we have large number of I/O spikes , is database performing good in terms of I/O waits we can measure easily by using following queries in the line.
Case 1:- You have been asked to verify the I/O spikes from database at present/current.
Step1:- Run the current_io_profile.sql which will show you the following and its latency. As told the total sum of all I/O is if not more than 20ms then it is good if not you will need to further dig out which sql/user performing more disk reads etc.
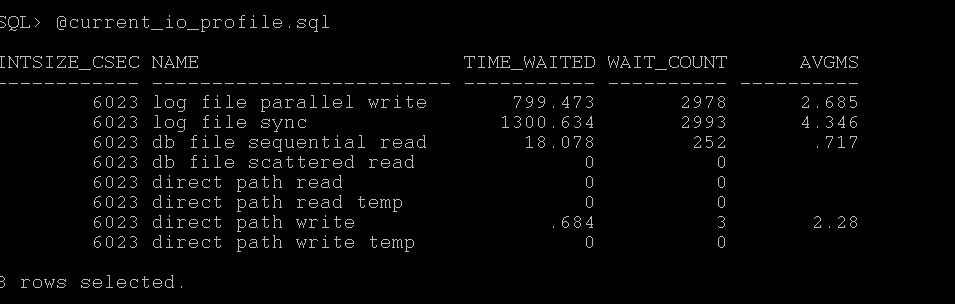
As you see the attached screenshot represents close to 7ms of avg waits for all I/O waits, so it may be okay.
Step2:- Further you can check at OS level using this post, http://db.geeksinsight.com/2013/02/01/unix-finding-high-io-waiting-process-in-linux/
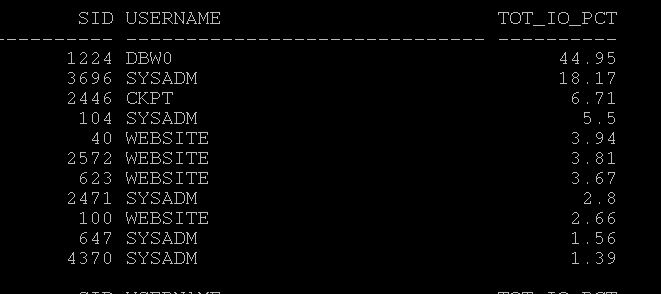
Step3:- Find which sessions that consuming high I/O, Run the current_top_io_consumer.sql and find the session causing it. Here in my case dbw0 causing more I/O.
Step4:- Find which statements causing high I/O, run current_high_reads.sql and see one of the statement caused many reads.
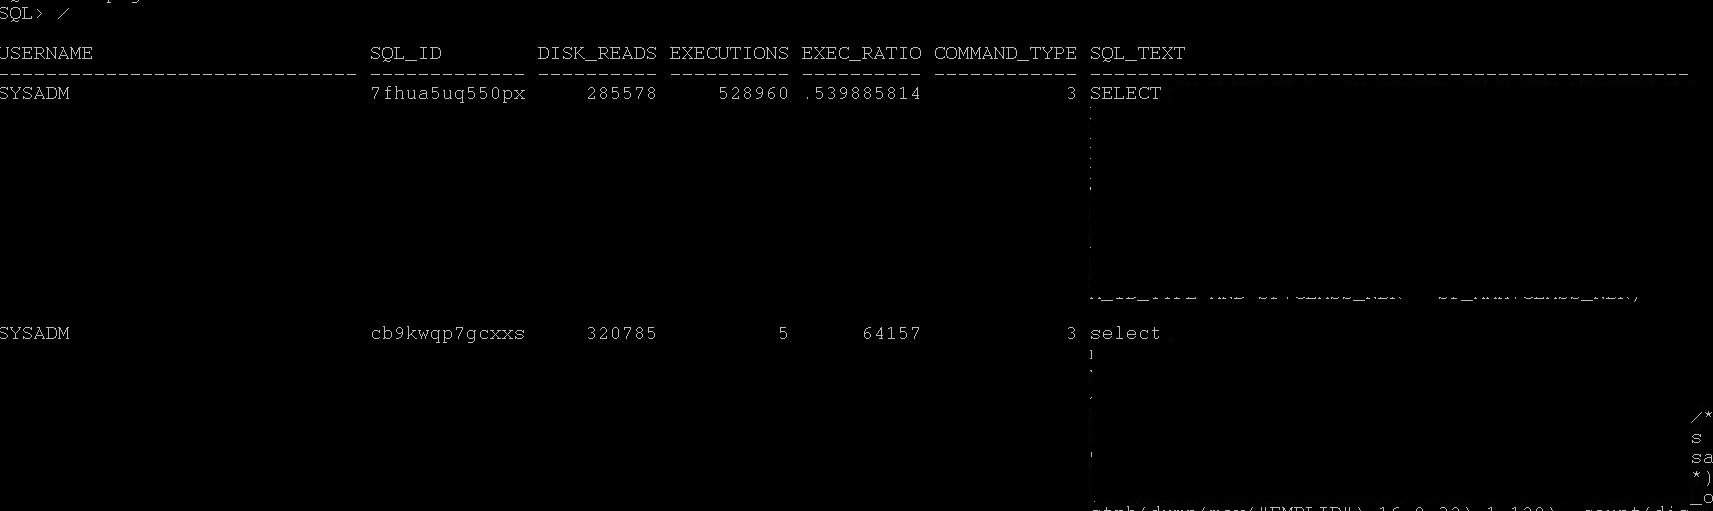
Step5: You may need to check what this SQL execution plan is any full tables happening, if so check for statistics etc.
select * from table(dbms_xplan.display_cursor('7fhua5uq550px'));
Step6:- Worth to understand how this sql performed previously and is there any change in number of executions and previous or any increase in volume of data caused more issues,, or whether optimizer is picking up wrong index etc.
Case 2:- You have been told to verify is there any I/O Spikes during some time back.
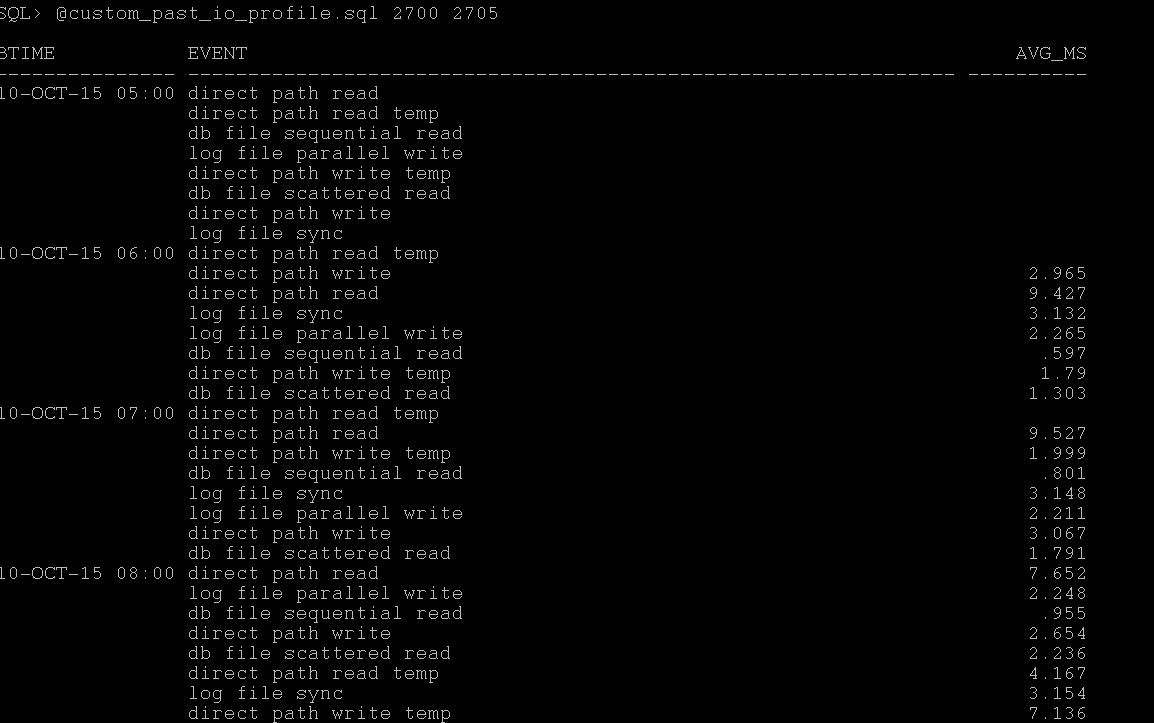
Step1:- Based on timings given, the snap ID's are 2700 and 2702 and running the awr_io_profile.sql (statspack_io_profile.sql) produce the following report which give you idea during which snap it has issue and again 20ms is base line you can check for all wait avg ms if its more than that you may encountering the issue.
Step 2:- Find which statements caused high reads during that period by running awr_high_reads.sql (statspack_high_reads.sql), for that snap_id you can get which statements having much disk reads etc.
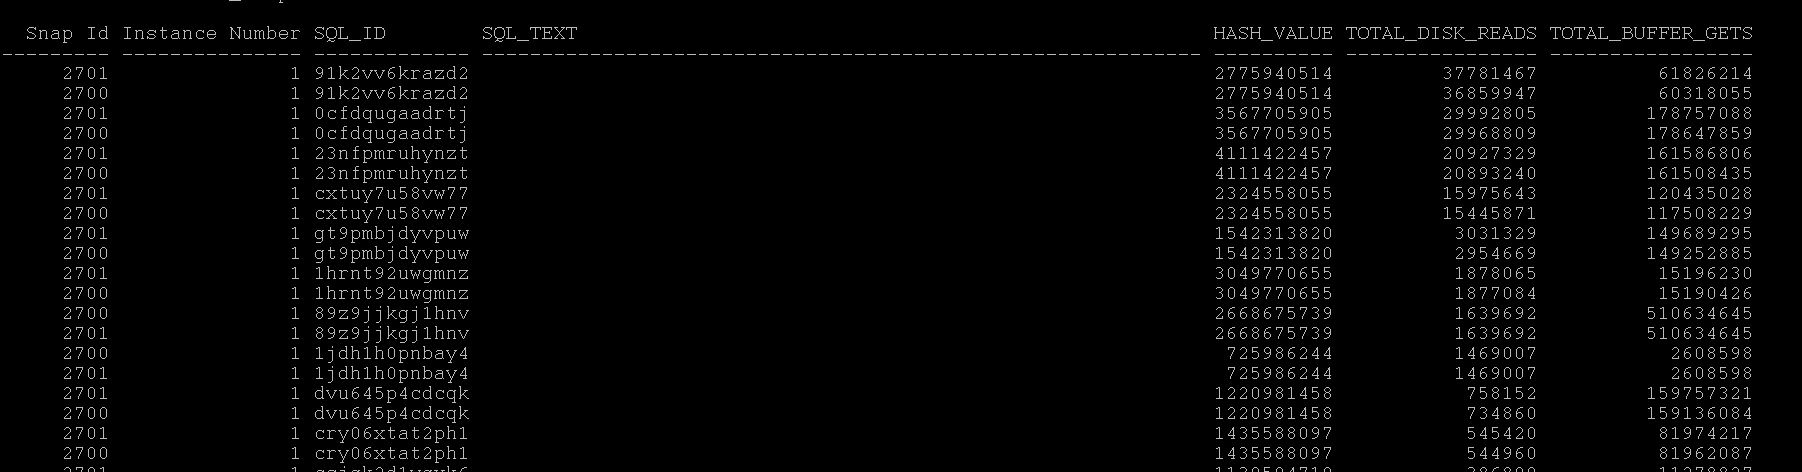
Step 3:- You can then run what is the execution plan for the given top sql id from awr,
select * from table(dbms_xplan.display_awr('91k2vv6krazd2'));
Step 4:- Now as with execution plan you can see where most of the rows coming and check what is the issue with high reads and reduce the reads by keeping index or collecting stats or rebuilding indexes so that optimizer may pickup index as it depends on what exact you have the situation is.
Note:- There are number of ways you can find this information with different tables and the approach may be different than mine, ultimately we should be able to identify the root cause of issue and fix accordingly
Next in Series:- Understanding CPU Utilization & Top Consumers
Hope this helps you!!!
Geek DBA
Hello,
This is the third post in this series, If you haven't read the previous articles please go through here,
First Post, http://db.geeksinsight.com/2015/10/08/performance-troubleshooting-series-understanding-your-oracle-database-load/
Second Post, http://db.geeksinsight.com/2015/10/09/performance-troubleshooting-series-understanding-your-database-load-from-metrics-part-2/
Starting 10g, Apart from Metrics tables, there is another area of troubleshooting can be done by using Time Model series. Its very useful to understand where is the over all time in the database that is spending using following tables.
Download For Current Using v$sys_time_model : Current_time_model.sql
Download From AWR using dba_hist_sys_time_model: awr_time_model.sql
Download From Statspack using stats$sys_time_model and stats$sys_time_model_name : statspack_time_model.sql
Example Report:-
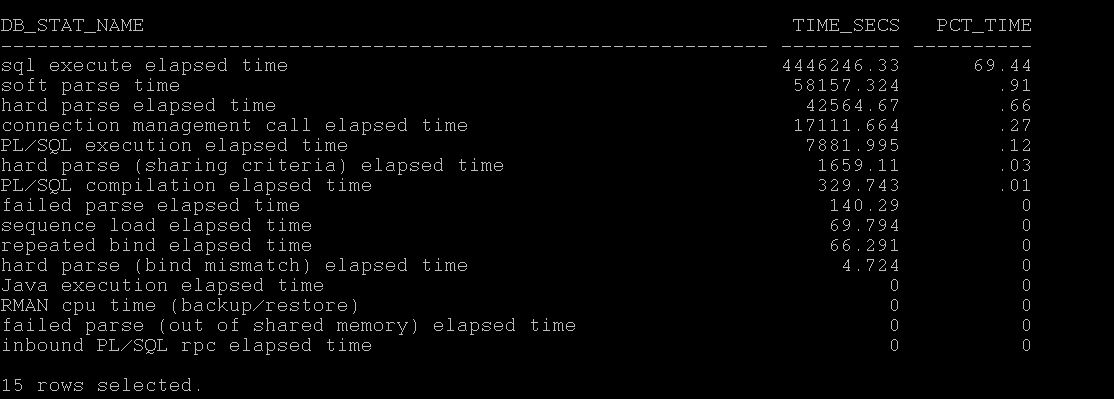
As you see above, the database in the question takes 69% of total time spent in executing SQL.
If you see, CPU or DB CPU that means Database has spent most of the time in processing on CPU.
If you see, hard parse elapsed time, then it means , most of the spending in hard parses.
If you see, RMAN spending on CPU in large percentages
If you see, Connection management call elapsed time, you may worth checking the no. of connection, network latencies etc.
So in this way you can understand with time model series where the most of the database time is spending.
The following action would be checking which statements are running long, doing lot of parses, or CPU related statements etc. (Long road ahead to write those)
Next in the Series, Understanding I/O Profile and I/O Latencies.
-Thanks
Geek DBA
Hello,
This is the second part of the series of Performance Troubleshooting, Whilst the first one is from AWR/Statspack tables.
And what if , if you don't have both in your environment, That made me to write up this second post.
Those who does not know about the metrics tables a short notes here, After that I will continue this post,
From 10g onwards, we have metrics collected as like v$sysstat and I believe this is the basis of AWR related stuff.
v$sysstat - RAW Live metrics (Contains 679 database performance metrics)
v$sysmetric-RAW Live metrics (Contains 205 metrics derived from sysstat or somewhere else)
v$sysmetric_history- Last one hour (Contains 10249 metrics for each metric in v$sysmetric for about 15sec or 60 sec interval)
v$sysmetric_summary-Last one hour (contains 158 metrics with aggregated values of history of one hour for each metric, i.e max,min,avg)
dba_hist* - Last seven days collection.
Note: the counts are as of 11gr2
Well, the question is what this metrics provides us?
Wonderful wealthy information, like How many reads per sec, CPU per sec, service times, network volume per sec, almost all information how your database is performing.
I hope the above information is enough for now, lets get back to post, This metrics are collected irrespective you are in standard edition/enterprise edition and also and your statistics level set to typical. I have myself verified the dba_hist* view which points to WRH* tables and derived from v$sysmetric views, and how many times I query those tables dba_features_usage does not reflect the same. I hope you also test to use this before using the following when you don't have AWR license.
For Previous & Historical : db_load_by_metrics.sql
Update: 10-Oct-2015 for rac instances (thanks to venkat) - db_load_by_metrics_rac.sql
For Current & Running Instance:- db_load_by_metrics_current.sql
The screenshot of the report and the explanation of each column and how to interpret the report. (Click to enlarge)
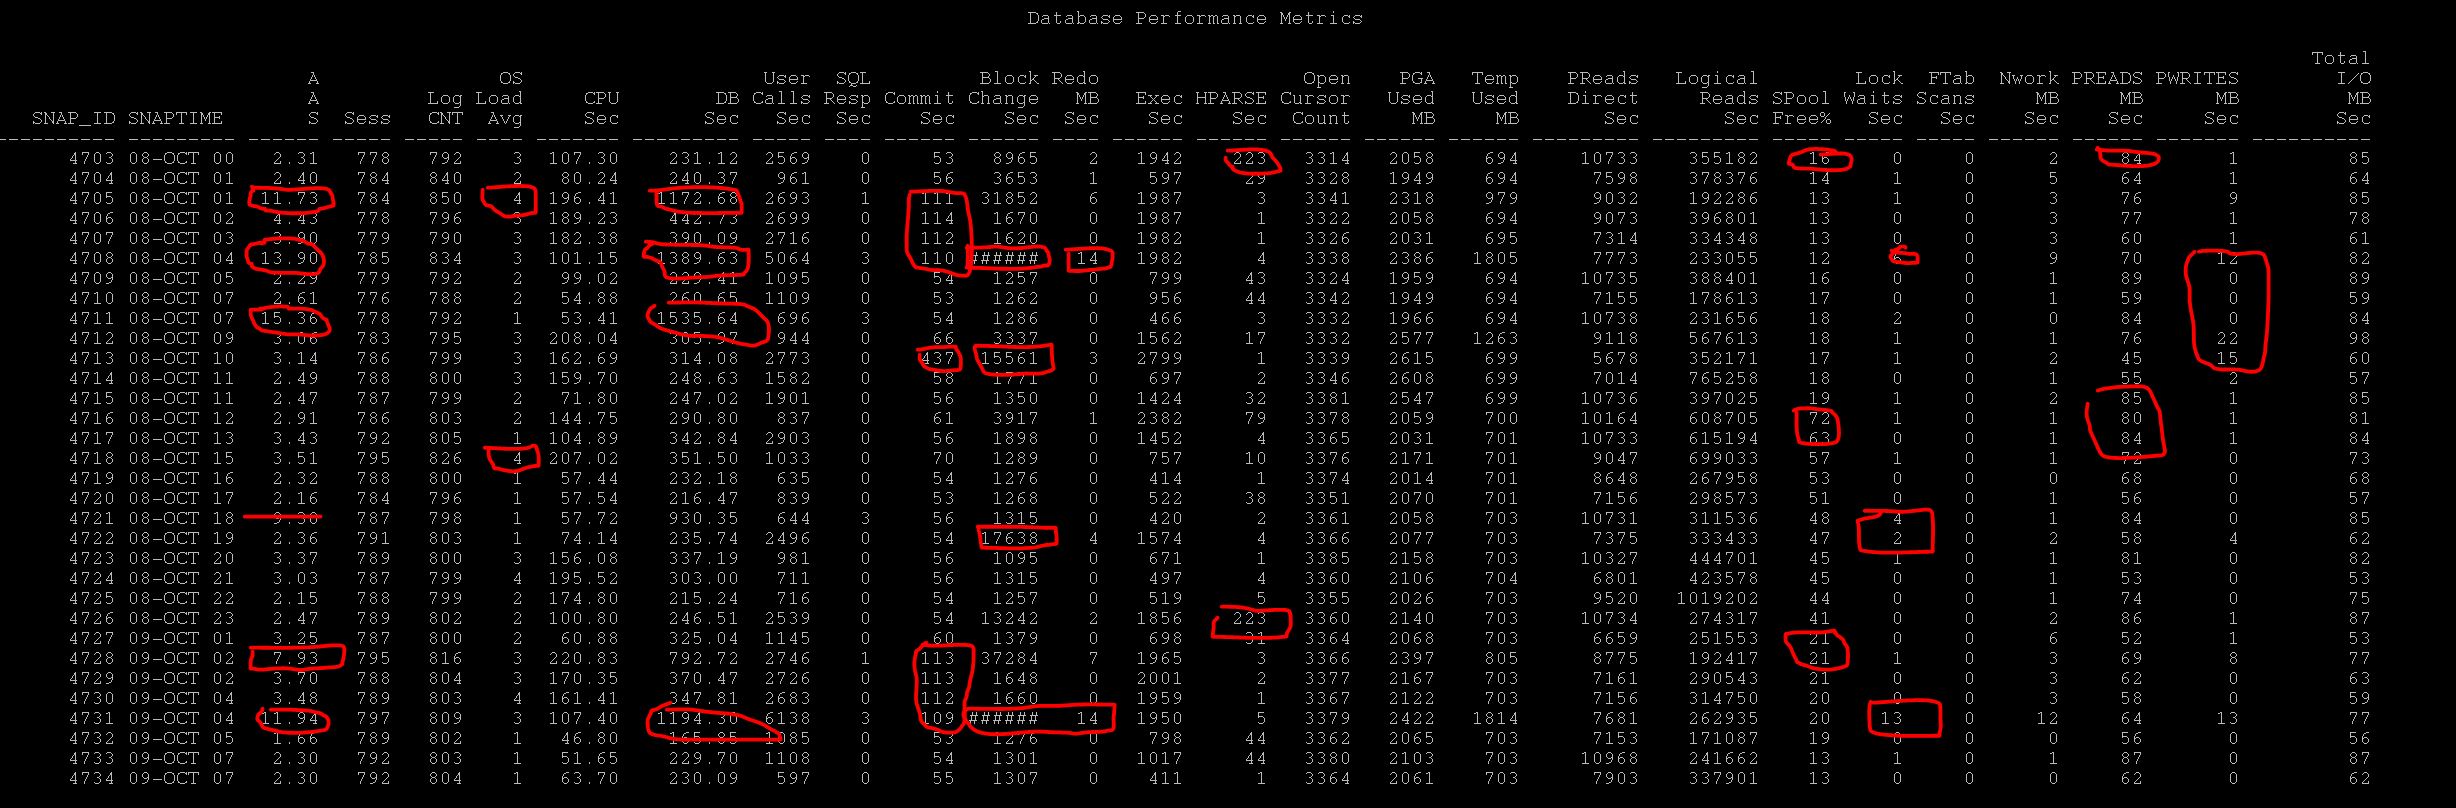
Now lets interpret the report,
| Question |
Column
to Verify
|
Additional
Related Columns
to Verify
|
Description or notes while troubleshooting |
|
check DB load
at so and so time
|
AAS |
DB Time,
Redo,
PReads,
PWrites,
Sessions
|
As you see AAS is high on certain period that is where the database is loaded, average active sessions
should be compared with your CPU_Count for the database and if its higher than that, then your database is loaded
Evidently, you can find additional information why the DB is loaded, is it excessive
Commits, DB Block Changes i.e DML, Reads, Writes, Locks, Wait in other columns which can easily spotted
|
|
Sessions/Process
Reached max limit
|
Sess/Logon |
|
By looking at this columns you can identify the sessions/process spike in database and can suggest whether there is
logon spike during that snap
|
| DB is slow |
AAS
SQL Resp Time
|
CPU, DB Time,
Reads/Writes/
PGA/Temp
SharedPool/HParses
Commits/DB BlockChanges
|
As told AAS is the basic metric you can see really the DB is slow or not, if under control below than your CPU count then it may else impacting your DB (i.e Single Statement but the DB is okay)
CPU , DB Time high numbers than other snapshot tells it is loaded
PReads/Writes tells whether any I/O issue at that snap
SPoolfree%/HParse/Execs , tells during that snap is there any excessive executions than before, or any excessive hard parses than before, If so any you may see the spoolfree% is drop down and that is evident.
Further, excessive commits and many db block changes can also hamper the performance with sessions waiting high log file sync which can be seen by the respective columns
|
| I/O Spikes |
PReads
PWrites
|
Total Preads/Writes
Executions
User Calls
Ftablescans
|
When you receive any I/O Spikes issue, check the columns to determine any I/O Spike during that snap period,
and the contributing factors can be many executions, many calls or Ftable scans
If its more calls/executions than before that means application is doing some nasty or running more load
If its ftablescans more than earlier, could be statistics issues, or again someone running full counts(*) or sorts or doing nasty
|
| Check DB response time |
SQL Resp
Time
|
User Calls |
This question is commonly asked by Application/Business teams always, DB response
To derive DB response time , simple metric can be SQL Service Response time per user call.
As you see above sometime the SQL Service Response time is 3 i.e in centiseconds and apparently there are many user calls
So you can clearly state that many user calls are degrading the sql service response time.
If not there may other factors like CPU waiting, More I/O etc, other columns may help to understand who is contributing to it.
|
| unable to allocate temp |
Temp Used |
PGA |
You can check during the period how much temp is used for each snap, if PGA is exhausting then it may use over temp so may be its worth to check the pga column is PGA is normally used. However, although PGA is undercontrol excessive sorts may be cause of it. But this column provides you the temp utilisation |
| Out of Process Memory |
PGA |
|
Every hour snap of PGA utilisation by sessions which gives a glance of total pga allocation to database.
If you see more utilisation worth while to consider the pga advisory
|
| Log File Sync |
commits |
redo mb per sec
db block changes
|
When you see sessions waiting for high log file sync, you may check any excessive commits during period and relavant db block changes and redo generated MB per sec, which gives you clue about the same |
| Check Locks during that time |
Lock Waits |
Db block changes
commits
|
When you have been asked to verify any locks during that time, the lock waits columns tells how many waits for locks during that snap is happening and if you see more yes, there is contention for lock , you need to go further troubleshoot with ASH to identify which sessions causing locks etc. |
| Network Spikes |
NWorkMB |
|
Is the database or user experiencing delays due to more network utilisation, that way also you can check in network utilized mb per sec. |
So, after reading this, the best possible questions and answers are derived from single query above rather generating multiple reports etc.
Again this report was derived from metric tables.
Questions & Suggestions are welcome. Hope this helps
-Geek DBA
Hello,
Very long back, Karlarao has written a wonderful script which delivers a exhaustive report for database performance. The script extracts the data from AWR repository tables.
Where in I have took liberty to tweak the same script for those who does not have AWR licensing and having statspack only.
Here is the script that can be run on statspack which generates similar report for database load representation. If you want to identify the database load from AWR report , you will need to generate multiple reports compare etc , but this report give you a glance of each snap and its respective load in terms of CPU/MEM/IO etc.
Script for Statspack Version:- statpack_gen_wl.sql
Script for AWR Version:- awr_gen_wl.sql
Report Screenshot (Click to enlarge)
Screenshot:- 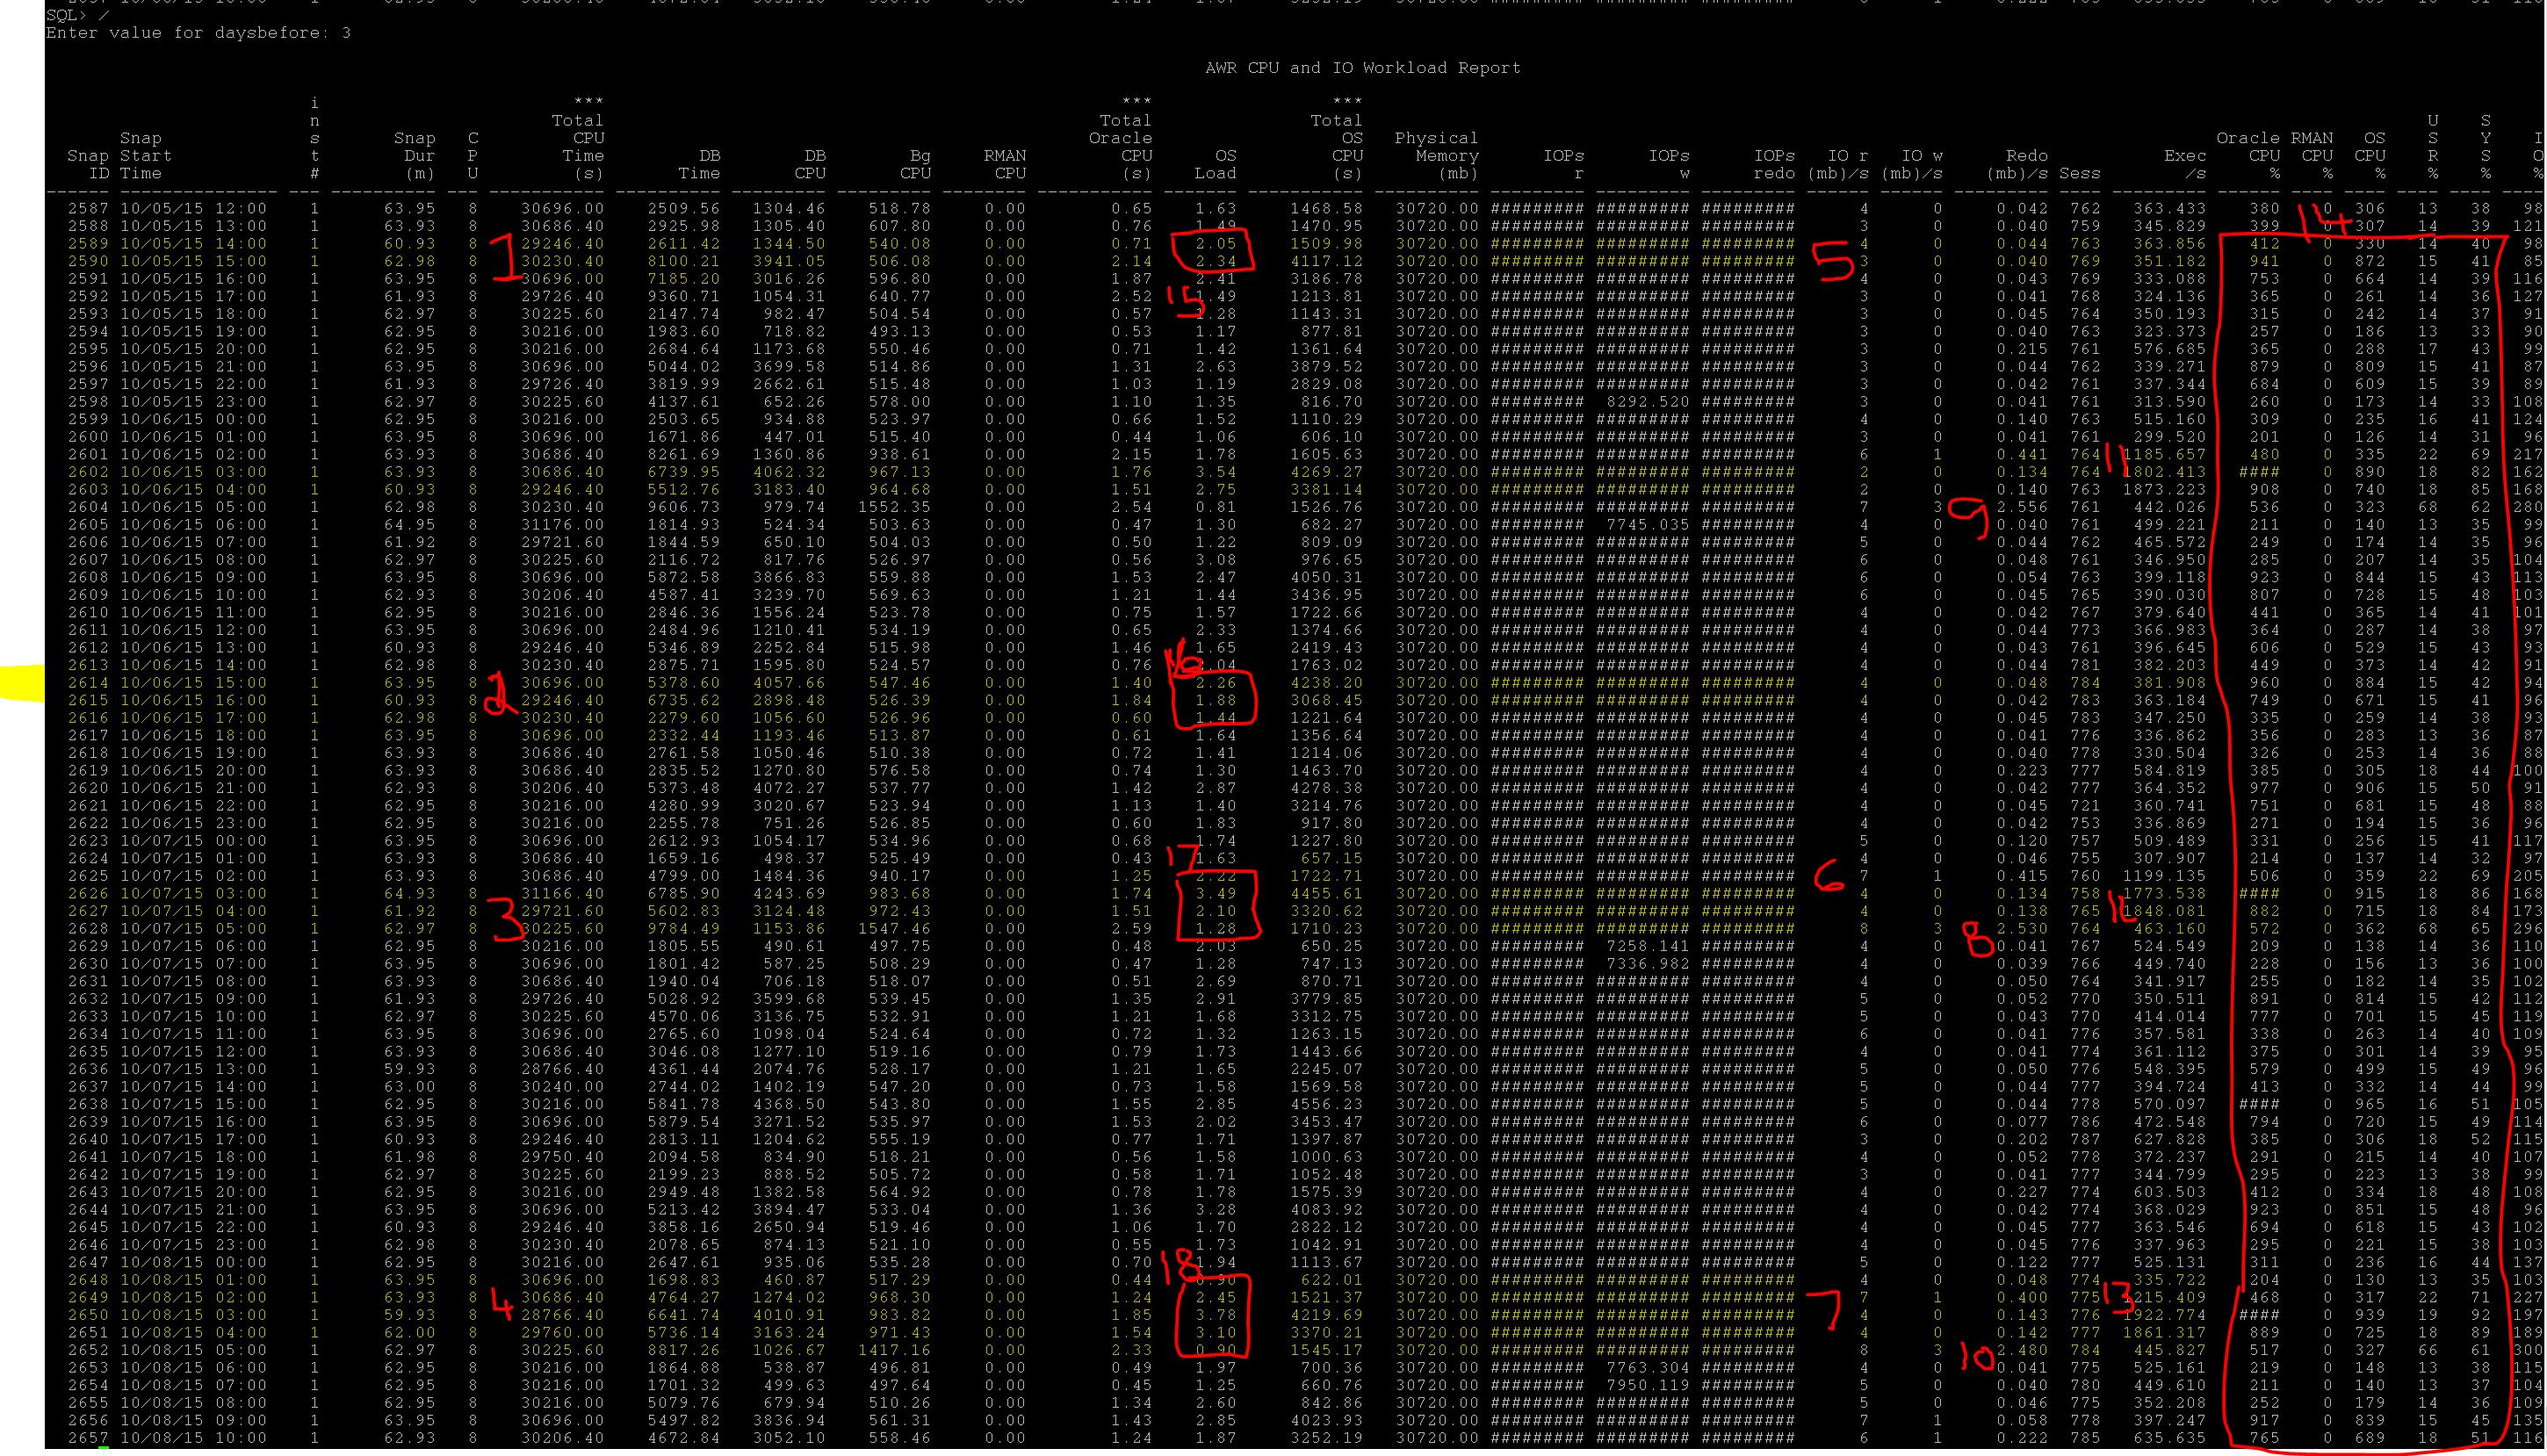
Alongside, here is the notes, Lets try to understand the report too. I have highlighted the important sections so that you can also look at your database performance.
1. Looking at 1,2,3,4, you can understand where is the most DB time utilized.
2. Looking at 5,4,6,7, you can understand that your database has more I/O utilization at that time.
3. Looking at 8,9,10, about redo , how much redo the database has generated. With this you can understand easily is there any DML activity happened at that time.
4. Looking at 11,12,13, about executions, we can cleverly know that database is doing more executions at what time also this tells you if you experience any memory contention in shared pool. Like ora-4031 errors just in case reporting or more cursors opened etc.
5. Looking at 14, the big box, we can divide the CPU load whether its RMAN, Oracle, OS CPU utilization and also in percentages of User or SYS user, which you can determine any backups running during that time etc or any SYS level activity to rule out maintenance stuff.
5. Looking at 15,16,17,18, you can understand OS load too
Well isnt it this report is cooler (except this will not tell you about ) than AWR (2 hours snap) to look at glance of database over period.
Hope this is useful.
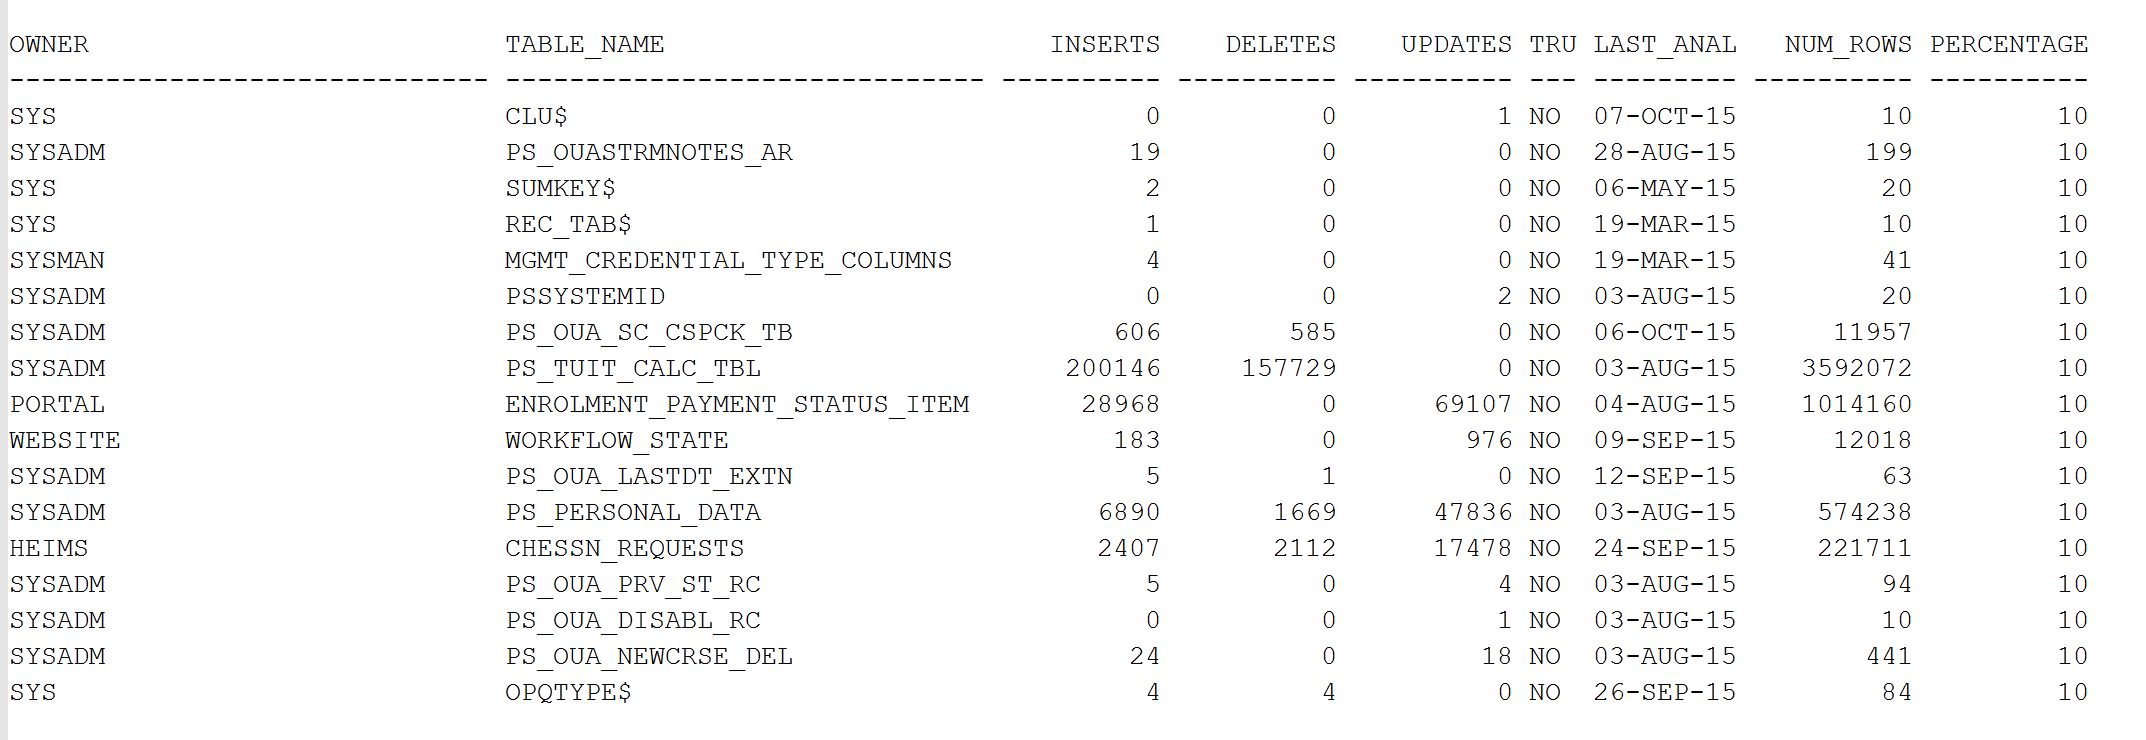
Ever, interested in looking for statistics staleness for each table including how much percent they stale are. The following query helps you to get you the details.
This query filter out the staleness for those tables which having more than or equal to 10%, you can adjust accordingly.
However, you will need to understand how this details are populated by reading this post, http://db.geeksinsight.com/2013/01/03/stats-change-statistics-stale-percentage-in-11g/
To change the database level statistics preferences for staleness , you need to do following.
SQL> Select dbms_stats.GET_PREFS('STALE_PERCENT') from dual;
DBMS_STATS.GET_PREFS('STALE_PERCENT')
---------------------------------------------
10
SQL> exec dbms_stats.set_database_prefs('STALE_PERCENT',9);
Back to the point, here is the query,
set heading on
set pages 1000
set lines 100
SELECT DT.OWNER,
DT.TABLE_NAME,
dtm.inserts,
dtm.deletes,
dtm.updates,
dtm.truncated,
dt.last_analyzed,
dt.num_rows,
ROUND ( (DELETES + UPDATES + INSERTS) / NUM_ROWS * 100) PERCENTAGE
FROM DBA_TABLES DT, DBA_TAB_MODIFICATIONS DTM
WHERE DT.OWNER = DTM.TABLE_OWNER
AND DT.TABLE_NAME = DTM.TABLE_NAME
AND NUM_ROWS > 0
--AND ROUND ( (DELETES + UPDATES + INSERTS) / NUM_ROWS * 100) >= 10
AND DT.TABLE_NAME='TSTS076'
ORDER BY 9 desc;
Click to Enlarge the screenshot
Hope it helps
Geek DBA
If you are working a production support DBA and very often you will need to check the statistics of the table and how much change what changed in each columns etc. I have figured out two ways for it and seems very useful.
Option 1:- 11gR1 has a package to show differences and comparison of statistics previous date and current date or what given date (30 days retention)
Step 1: set longchunksize 10000 pages 1000 lines 1000 long 100000
Step 2:- select * from table(dbms_stats.diff_table_stats_in_history(
ownname => user,
tabname => upper('&tabname'),
time1 => systimestamp,
time2 => to_timestamp('&time2','yyyy-mm-dd:hh24:mi:ss'),
pctthreshold => 0));
Enter value for tabname: TEST
old 3: tabname => upper('&tabname'),
new 3: tabname => upper('TEST'),
Enter value for time2: 2015-08-20:10:00:00
old 5: time2 => to_timestamp('&time2','yyyy-mm-dd:hh24:mi:ss'),
new 5: time2 => to_timestamp('2015-08-20:10:00:00','yyyy-mm-dd:hh24:mi:ss'),
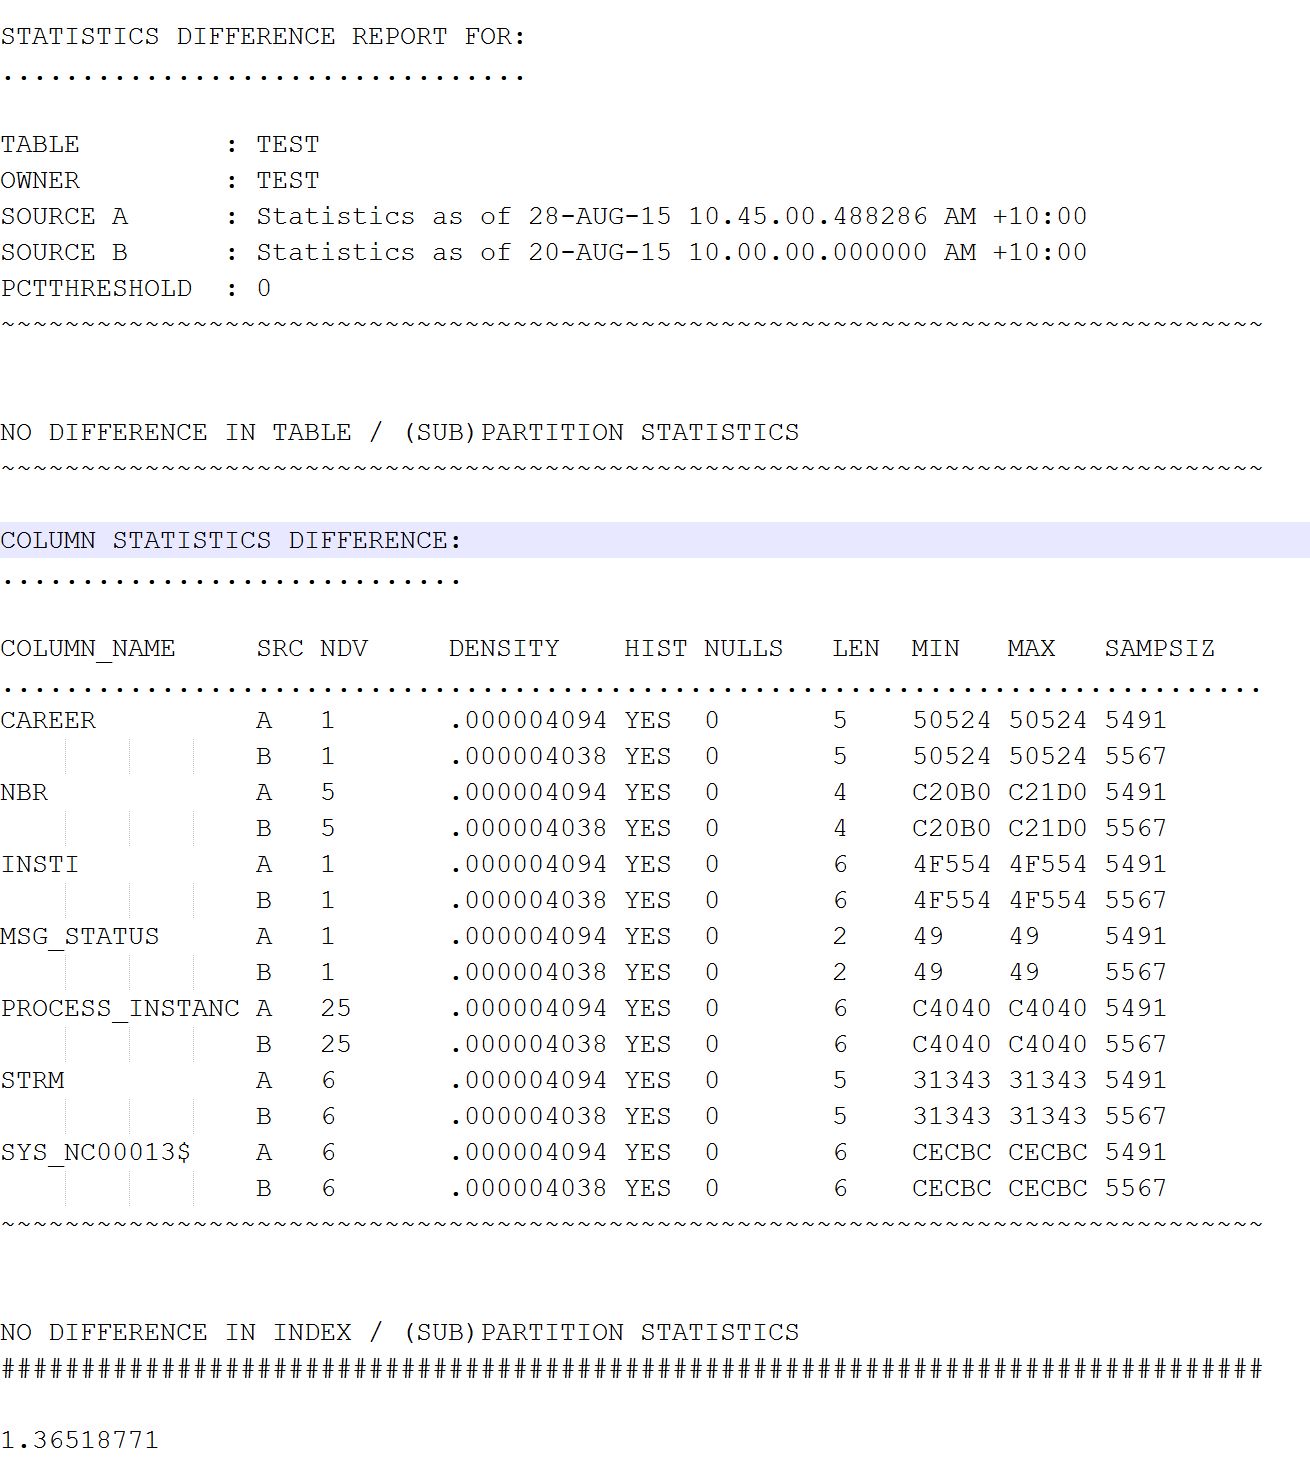
Step 3:- You get an output like below. Nice isn't it? And also gives the ability to understand which column has difference more. A & B tells the A period and B period, Min Max tells the minimum/maximum num of rows
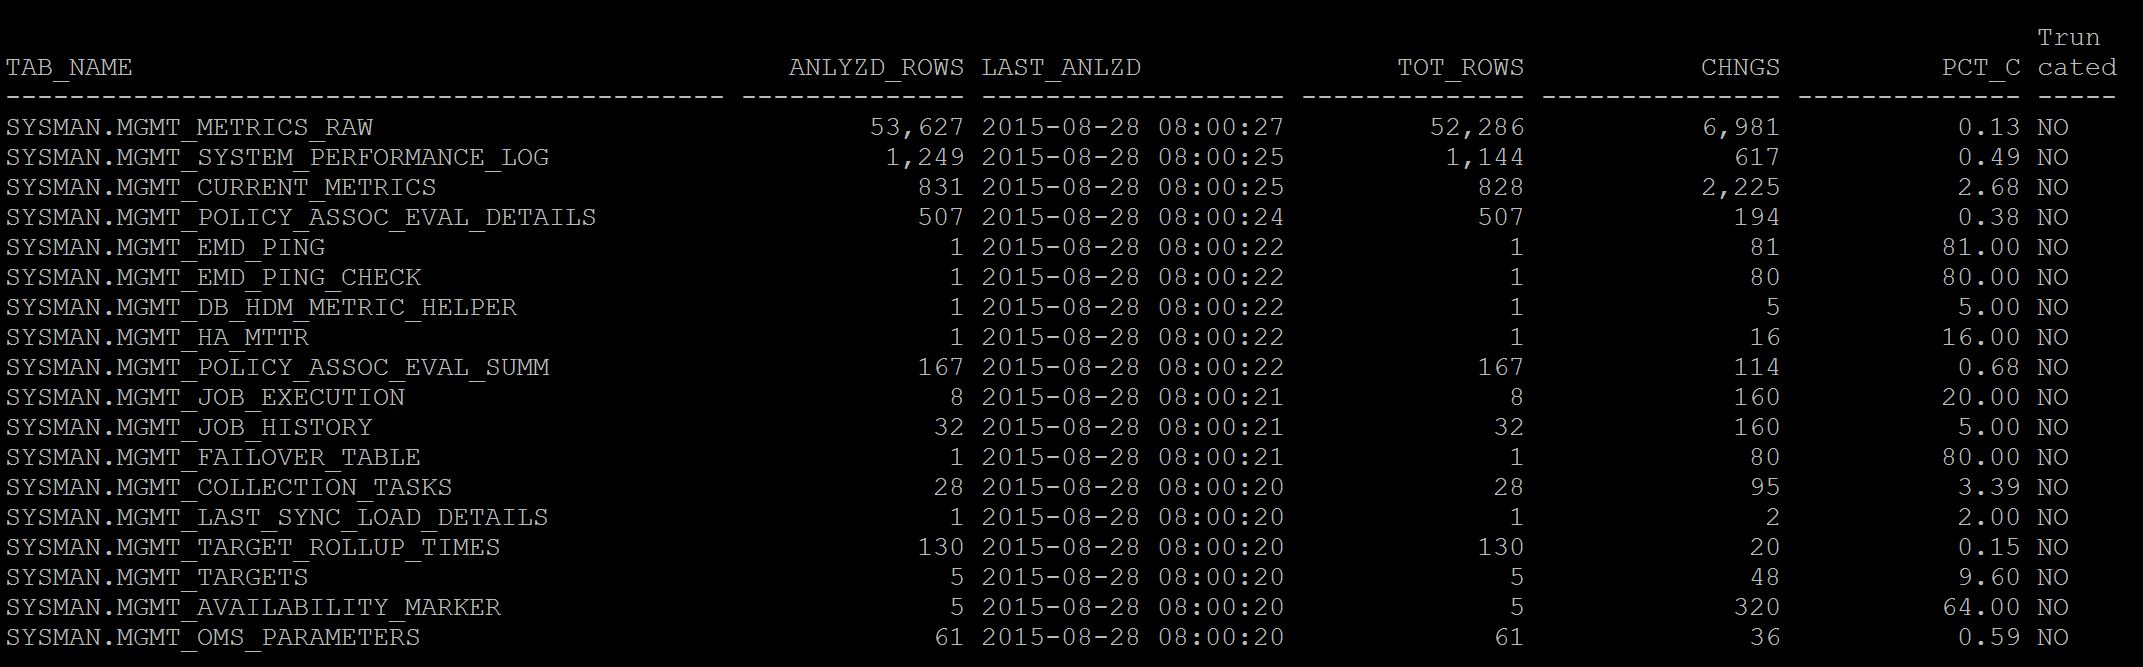
Option:-2 - Just run the plain query to percentage the change of statistics in dba_tab_statistics and dba_tab_modification_history
colu anlyzd_rows form 99999,999,999
colu tot_rows form 99999,999,999
colu tab_name form a45
colu chngs form 99,999,999,999
colu pct_c form 9999999990.99
col truncated head 'Trun|cated' for a5 justify l
select dbta.owner||'.'||dbta.table_name tab_name
, dbta.num_rows anlyzd_rows
, to_char(dbta.last_analyzed,'yyyy-mm-dd hh24:mi:ss') last_anlzd
, nvl(dbta.num_rows,0)+nvl(dtm.inserts,0) -nvl(dtm.deletes,0) tot_rows
, nvl(dtm.inserts,0)+nvl(dtm.deletes,0)+nvl(dtm.updates,0) chngs
,(nvl(dtm.inserts,0)+nvl(dtm.deletes,0)+nvl(dtm.updates,0)) /greatest(nvl(dbta.num_rows,0),1) pct_c
, dtm.truncated
from dba_tab_statistics dbta
left outer join sys.dba_tab_modifications dtm
on dbta.owner = dtm.table_owner
and dbta.table_name = dtm.table_name
and dtm.partition_name is null
where
--and
--dbta.last_analyzed < sysdate - 1
STALE_STATS = 'YES'
and dbta.owner='&owner' order by dbta.last_analyzed desc;
And the output as below. As you see below the percentage change of DML for each table after last stats collection, this helps you to keep additional jobs in place for very much volatile tables.
Geek DBA
The situation is, and you just logged 🙂
1. DB Response is slow
2. Top/OEM/Graphs show your database host CPU is pegged to 100%, and (no other things running apart from db)
3. Unfortunately you do not have Active Session History, to fire a magical script , 5 minutes back, 10 minutes back,
4. You just need to check current statements quickly which just pegging CPU
5. And the Weird things, if you are in Cloud or kind of DBAAS, you just cant do SSH (really) , so you cant find top process ID from TOP
So with all conditions above, the following script really really saving my life here 🙂
select
se.SID,
ss.serial#,
ss.username,
ss.machine,
ss.sql_id,
to_char(s.last_active_time,'DD-MON-YY HH:MI:SS'),
s.last_load_time,
VALUE/100 cpu_usage_seconds ,
substr(s.sql_text,1,100)
from
v$session ss,
v$sesstat se,
v$statname sn,
v$sql s
where
se.STATISTIC# = sn.STATISTIC#
and
NAME like '%CPU used by this session%'
and
se.SID = ss.SID
--and
--ss.status='ACTIVE'
--and
-- ss.username is not null and ss.username!='DBMANAGER'
and
ss.sql_id=s.sql_id
order by VALUE desc;
And the output, As you see two processes pegging CPU 129 and 40 of about more than 100% (thats actually calculation issue) and what next kill it and save your database.

And another

Does any knows about flushing the PGA?
Actually it can, not quite sure of release memory or not as it depends on high water mark (as like you try to shrink the datafile and it fails) similarly the following procedure also may not work if a memory chunk sitting at the edge of high water mark . So works sometime may not work too.
Just for knowledge purpose.
exec SYS.DBMS_SESSION.FREE_UNUSED_USER_MEMORY;
Geeks
Not strange though, but well possible to get into trap of permission issue from 11gr2 GI since the user separation (GI Owner, RDBMS Owner) and the additional groups (asmadmin, asmoper etc) has created lots of mess around, especially when you are not good in selecting the right groups/owners in the installation.
I have been told in one environment to check that, they were not able to create the database using DBCA although the GI/RDBMS installation was successful.
However, This environment is using only oracle user for both GI and RDBMS and hence should not be any issue.
Here is the snapshot that captured

DBCA failing with DG4 permission issue , ora-27303 startup egid – 60321 (oinstall), current egid = 60329 (asmadmin)
Verified the DG4 permission using crsctl getperm ora.DG4-dg where in its set oinstall and oracle as it owner, so no problem there
[root@orars4 dbs]# crsctl getperm resource ora.DG4.dg
Name: ora.DG4.dg
owner:oracle:rwx,pgrp:oinstall:r-x,other::r--,group:oinstall:r-x,user:oracle:rwx
Could be permission issue with executables hence checked both executable ownership and permission
GI
[oracle@rac1 trace]$ ls $ORACLE_HOME/bin/oracle
/u01/app/11204/grid/bin/oracle
[oracle2@orars4 trace]$ ls -l $ORACLE_HOME/bin/oracle
-rwsr-s--x. 1 oracle oinstall 239626683 Feb 20 14:19 /u01/app/11204/grid/bin/oracle
RDBMS
[oracle@rac1 trace]$ ls $ORACLE_HOME/bin/oracle
/u01/app/11204/db_1/bin/oracle
[oracle2@orars4 trace]$ ls -l $ORACLE_HOME/bin/oracle
-rwsr-s--x. 1 oracle asmadmin 239626683 Feb 20 14:19 /u01/app/11204/db_1/bin/oracle
As you see the RDBMS executable has set with asmadmin, it should be oinstall
Resolution:-
1. Changed the group manually , chown oracle:oinstall oracle (Not worked)
2. There's a executable called setasmgidwrap which can be used to set the gid for RDBMS oracle executable as like GI oracle executable in $ORACLE_HOME/bin directory,
[oracle@rac1 lib]$ cd $GRID_HOME/bin
/'
[oracle@rac1 bin]$ ./setasmgidwrap o=/u01/app/11204/db_1/bin/oracle
[oracle@rac1 bin]$ ls -l /u01/app/11204/db_1/bin/oracle
-rwxr-s--x. 1 oracle oinstall 239626683 Feb 20 14:19 /u01/app/11204/grid/bin/oracle
This has not worked either, after running dbca the permission got changed again back to asmadmin
3. Upon checking more in the asmsetgid script, its calling config.o file in $ORACLE_HOME/rdbms/lib and contains the roles which you selected in the grid installation
Note:- This should require bounce of CRS/RDBMS instances as such you will need to perform a relink after changing this file, do at your own risk
cd $ORACLE_HOME/rdbms/lib
vi config.c
Change the following lines (group name)
#define SS_DBA_GRP "asmdba"
#define SS_OPER_GRP "asmoper"
#define SS_ASM_GRP "asmadmin"
to
#define SS_DBA_GRP "dba"
#define SS_OPER_GRP "oper"
#define SS_ASM_GRP "oinstall"
Shutdown CRS stack and relink (before relink take a backup of oracle home)
# crsctl stop crs
[oracle@rac1 grid]$ cd $ORACLE_HOME/rdbms/lib
[oracle@rac1 lib]$ $ORACLE_HOME/bin/relink all
Ensure you do not have any relink errors in relink.log
4. Finally run the setasmgidwrap script to set the RDBMS oracle binary.
[oracle@rac1 lib]$ cd $GRID_HOME/bin
'
[oracle@rac1 bin]$ ./setasmgidwrap o=/u01/app/oracle/11204/db_1/bin/oracle
5. run dbca and see if problem disappear.
Well , we have got an issue that one of the node is not starting up , its a two node GRID Infrastructure and the logs shown as below
in crs alert_rac01.log
CRSD not started – unable to locate OCR
in gipcd.log
2014-09-10 06:23:00.186: [ GIPC][1117619840] gipcCheckInitialization: possible incompatible non-threaded init from [prom.c : 730], original from [clsCrsctlUtil.cpp : 2934]
2014-09-10 06:23:00.186: [ OCRMSG][1117619840]prom_waitconnect: CONN NOT ESTABLISHED (0,29,1,2)
2014-09-10 06:23:00.186: [ OCRMSG][1117619840]GIPC error [29] msg [gipcretConnectionRefused]
2014-09-10 06:23:00.186: [ OCRMSG][1117619840]prom_connect: error while waiting for connection complete [24]
2014-09-10 06:24:24.809: [ OCRMSG][240011008]GIPC error [29] msg [gipcretConnectionRefused]
When verified the private network and public networks are working fine
Another important thing is if you stop the running node and start the other node it works fine, so that means at any point of time only one node is working.
This is some what known issue and have already written something about back in 2012 and at that time instances were crashing due to cluster crash. But still old issue.
Just to make everyone aware , ensure there should be no internal devices like usb0 or something enabled in cluster since the private network uses haip with internal IP in 169.* format and the internal devices also uses same range to communicate hence, the crsd get confused and reach the usb device rather cluster node and does not found any OCR. Sounds funny but yes. Read here
http://db.geeksinsight.com/2012/09/24/pmon-ospid-nnnn-terminating-the-instance-due-to-error-481/
Hope this helps
|


Follow Me!!!