Hello,
This is the second part of the series of Performance Troubleshooting, Whilst the first one is from AWR/Statspack tables.
And what if , if you don't have both in your environment, That made me to write up this second post.
Those who does not know about the metrics tables a short notes here, After that I will continue this post,
From 10g onwards, we have metrics collected as like v$sysstat and I believe this is the basis of AWR related stuff.
v$sysstat - RAW Live metrics (Contains 679 database performance metrics)
v$sysmetric-RAW Live metrics (Contains 205 metrics derived from sysstat or somewhere else)
v$sysmetric_history- Last one hour (Contains 10249 metrics for each metric in v$sysmetric for about 15sec or 60 sec interval)
v$sysmetric_summary-Last one hour (contains 158 metrics with aggregated values of history of one hour for each metric, i.e max,min,avg)
dba_hist* - Last seven days collection.
Note: the counts are as of 11gr2
Well, the question is what this metrics provides us?
Wonderful wealthy information, like How many reads per sec, CPU per sec, service times, network volume per sec, almost all information how your database is performing.
I hope the above information is enough for now, lets get back to post, This metrics are collected irrespective you are in standard edition/enterprise edition and also and your statistics level set to typical. I have myself verified the dba_hist* view which points to WRH* tables and derived from v$sysmetric views, and how many times I query those tables dba_features_usage does not reflect the same. I hope you also test to use this before using the following when you don't have AWR license.
For Previous & Historical : db_load_by_metrics.sql
Update: 10-Oct-2015 for rac instances (thanks to venkat) - db_load_by_metrics_rac.sql
For Current & Running Instance:- db_load_by_metrics_current.sql
The screenshot of the report and the explanation of each column and how to interpret the report. (Click to enlarge)
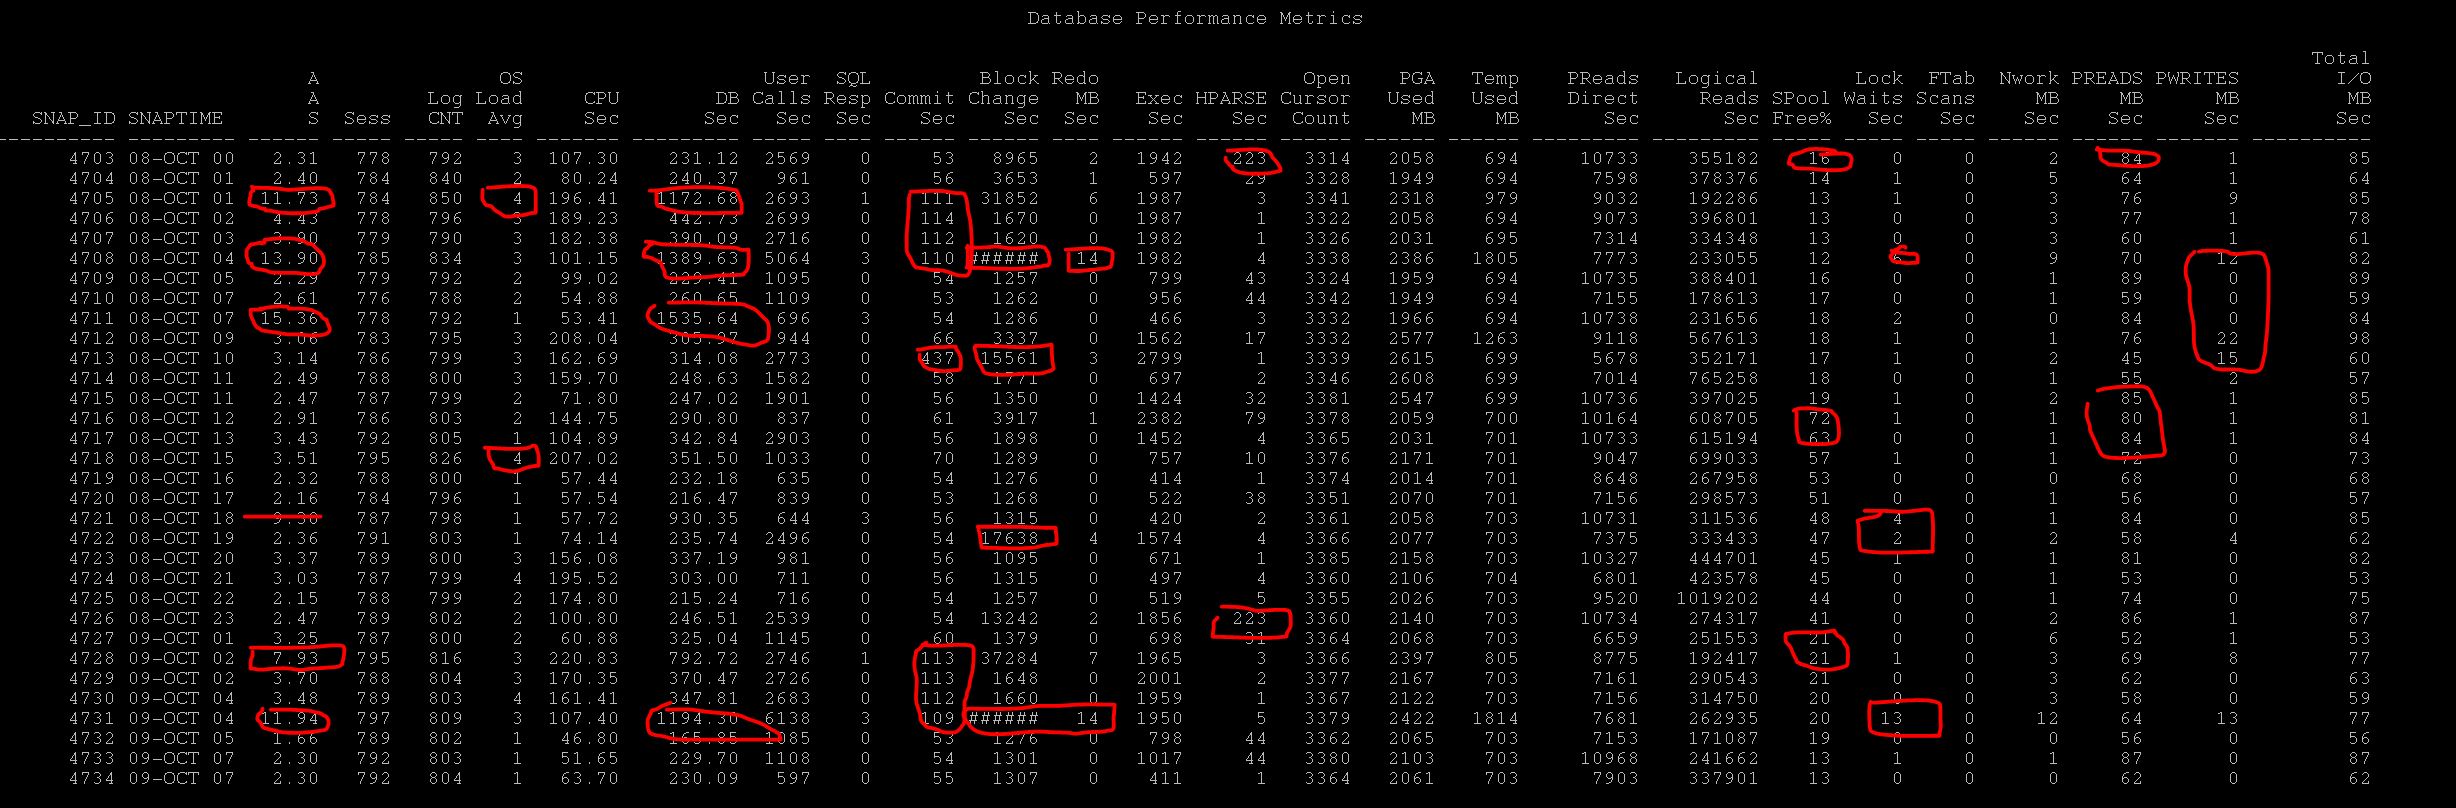
Now lets interpret the report,
| Question |
Column to Verify |
Additional Related Columns to Verify |
Description or notes while troubleshooting |
|
check DB load at so and so time |
AAS |
DB Time, Redo, PReads, PWrites, Sessions |
As you see AAS is high on certain period that is where the database is loaded, average active sessions should be compared with your CPU_Count for the database and if its higher than that, then your database is loaded Evidently, you can find additional information why the DB is loaded, is it excessive Commits, DB Block Changes i.e DML, Reads, Writes, Locks, Wait in other columns which can easily spotted |
|
Sessions/Process Reached max limit |
Sess/Logon |
By looking at this columns you can identify the sessions/process spike in database and can suggest whether there is logon spike during that snap |
|
| DB is slow |
AAS SQL Resp Time |
CPU, DB Time, Reads/Writes/ PGA/Temp SharedPool/HParses Commits/DB BlockChanges |
As told AAS is the basic metric you can see really the DB is slow or not, if under control below than your CPU count then it may else impacting your DB (i.e Single Statement but the DB is okay) CPU , DB Time high numbers than other snapshot tells it is loaded PReads/Writes tells whether any I/O issue at that snap SPoolfree%/HParse/Execs , tells during that snap is there any excessive executions than before, or any excessive hard parses than before, If so any you may see the spoolfree% is drop down and that is evident. Further, excessive commits and many db block changes can also hamper the performance with sessions waiting high log file sync which can be seen by the respective columns |
| I/O Spikes |
PReads PWrites |
Total Preads/Writes Executions User Calls Ftablescans |
When you receive any I/O Spikes issue, check the columns to determine any I/O Spike during that snap period, and the contributing factors can be many executions, many calls or Ftable scans If its more calls/executions than before that means application is doing some nasty or running more load If its ftablescans more than earlier, could be statistics issues, or again someone running full counts(*) or sorts or doing nasty |
| Check DB response time |
SQL Resp Time |
User Calls |
This question is commonly asked by Application/Business teams always, DB response To derive DB response time , simple metric can be SQL Service Response time per user call. As you see above sometime the SQL Service Response time is 3 i.e in centiseconds and apparently there are many user calls So you can clearly state that many user calls are degrading the sql service response time. If not there may other factors like CPU waiting, More I/O etc, other columns may help to understand who is contributing to it. |
| unable to allocate temp | Temp Used | PGA | You can check during the period how much temp is used for each snap, if PGA is exhausting then it may use over temp so may be its worth to check the pga column is PGA is normally used. However, although PGA is undercontrol excessive sorts may be cause of it. But this column provides you the temp utilisation |
| Out of Process Memory | PGA |
Every hour snap of PGA utilisation by sessions which gives a glance of total pga allocation to database. If you see more utilisation worth while to consider the pga advisory |
|
| Log File Sync | commits |
redo mb per sec db block changes |
When you see sessions waiting for high log file sync, you may check any excessive commits during period and relavant db block changes and redo generated MB per sec, which gives you clue about the same |
| Check Locks during that time | Lock Waits |
Db block changes commits |
When you have been asked to verify any locks during that time, the lock waits columns tells how many waits for locks during that snap is happening and if you see more yes, there is contention for lock , you need to go further troubleshoot with ASH to identify which sessions causing locks etc. |
| Network Spikes | NWorkMB | Is the database or user experiencing delays due to more network utilisation, that way also you can check in network utilized mb per sec. |
So, after reading this, the best possible questions and answers are derived from single query above rather generating multiple reports etc.
Again this report was derived from metric tables.
Questions & Suggestions are welcome. Hope this helps
-Geek DBA
[…] Second Post, http://db.geeksinsight.com/2015/10/09/performance-troubleshooting-series-understanding-your-database… […]
[…] Looking at identifying Database Load in previous posts (Post 1,Post 2) and seeing where the database time spending much (Post 3). Its time to check out how I/O is […]
[…] parts in the series we have covered, DB Load Profile, DB Load Profile2, Time Model, IO […]
[…] In the previous series we have seen how to troubleshoot IO, CPU and Database TimeSpent/Consumed, […]
[…] 1 and Part 2 of the […]