In the previous series we have seen how to troubleshoot IO, CPU and Database TimeSpent/Consumed,
Today's Post I will be sharing with you the most common issues or to tackle memory related questions.
As we all know Oracle does manage things (blocks/modifications) in memory and track them in memory and sort them in memory and store them in memory and users first read the memory structures only not the disk.
So how big the memory should be, Does that memory is adequate sized, if not what kind of waits you will be seeing specifically for those memory structures like PGA, Shared Pool, Buffer Cache etc.
I will be starting as of 10g only, these so called memory structures are managed by oracle by MMAN & MMNL processes when sga_target/memory_max_target is set > 0. That means if any of the pools with in SGA is required to adjust with in themselves these background process help to do that for you. In earlier versions , DBA has to manually resize them as require during batch timings and during day timings (I am the one of those DBA too who did it often previously). So that relieves a major work from DBA. But there are many questions about SGA utilization and PGA utilization and sizing and historical usage.
Okay, now proceed with typical question and answers and related troubleshooting tips.
| Question | Views Needed | Description | Historical Queries |
| A new database, How much SGA/PGA you need? | None | This is tricky, you cannot fit entire database into memory.
So ideally when a new database anticipating the common sizing start with 2g for medium and 4g for larger instances and you will need to capacity plan until you have some baseline. To capacity plan the next row will answer the question |
|
| A older database, Capacity Plan the SGA/PGA? | Current:-
v$sga_target_advice v$pga_target_advice v$shared_pool_advice v$db_cache_advice v$memory_target_advice historical:- dba_hist* |
To Understand Current/Historical SGA sizing and performance
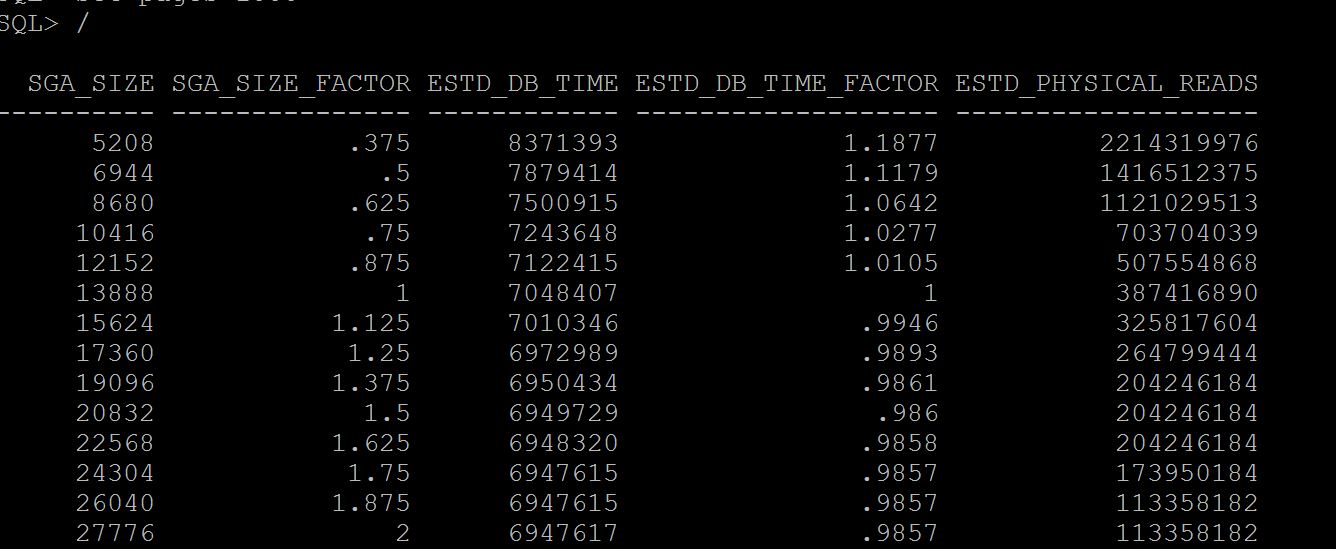
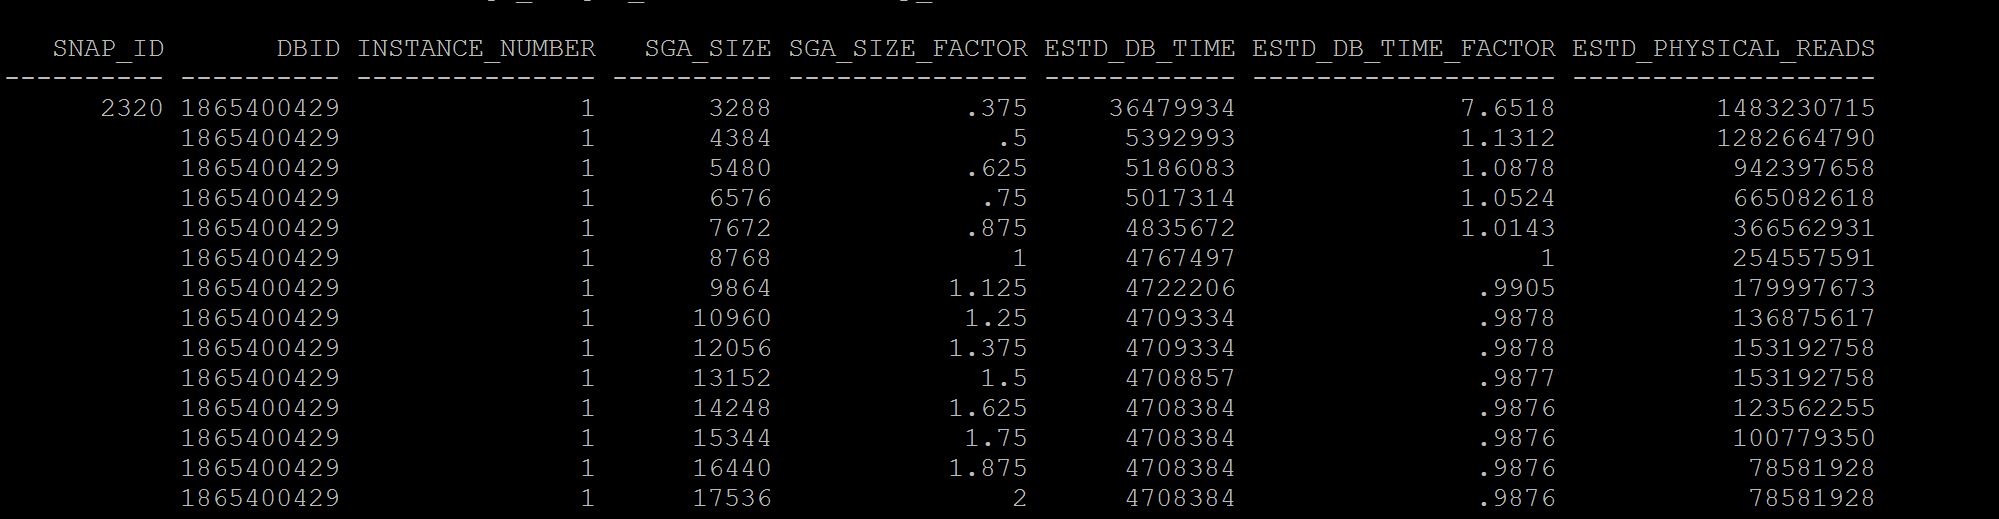
SQL> select * from v$sga_target_advice; SQL> select * from dba_hist_sga_target_advice where snap_id =&id;
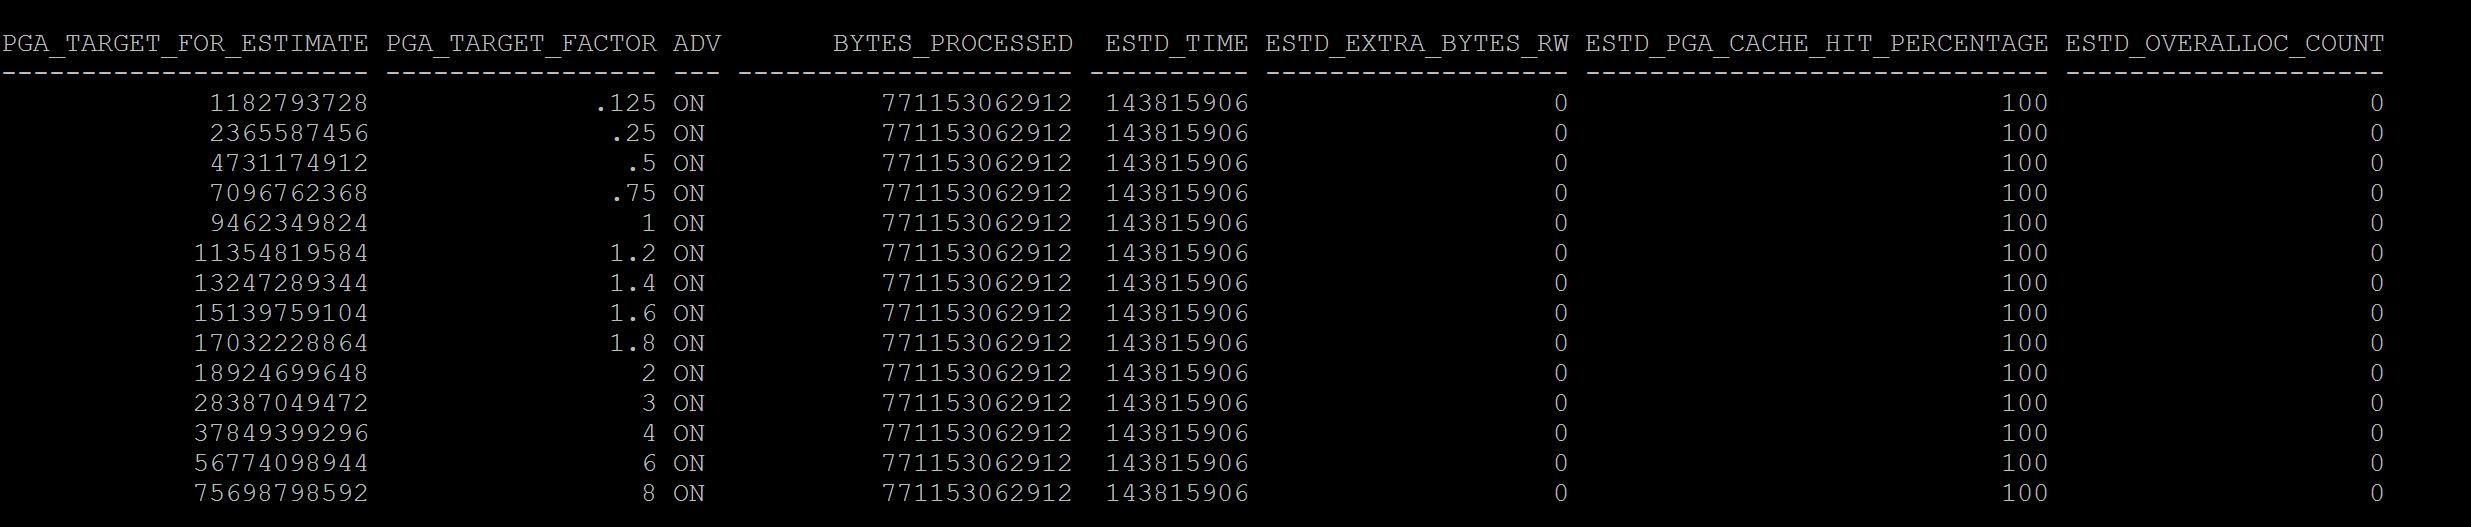
Notes:- See at column sga_size_factor, where there is 1, its your current setting of sga, so when you have this setting size for example in above case 13gb the number of estimated physical reads were 387416890, if we increase to double the size i.e where the sga_size_factor is 2, i.e 27gb (last line) our database just have 113358182 physical reads. So there may be benefit. If benefit is less that means your sga is adequate and need to increase. Not only physical reads you can see the estimated db time from 7048407 to 6947617 it varies, that means I dont have benefit in terms of DB time but may benefit from physical reads. If you are running a 11g memory management features i.e SGA+PGA combined use v$memory_target_advice instead. To Understand Current/Historical PGA Sizing and performance SQL> select * from v$pga_target_advice; SQL> select * from dba_hist_pga_target_advice where snap_id=&id; Good one Bad One
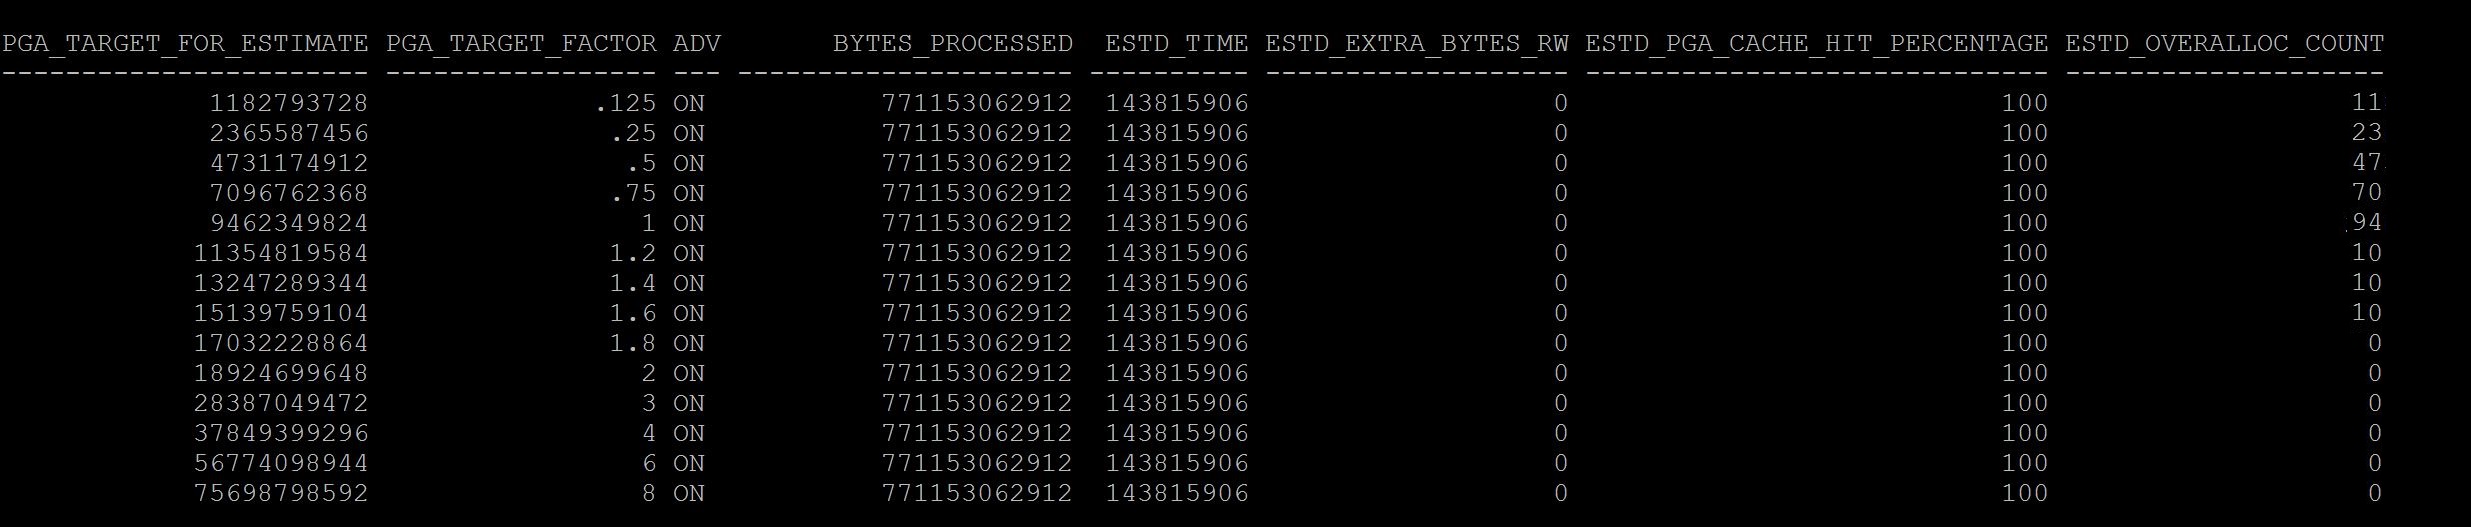
What you have observed between good and bad screenshots? The current value again stays with pga_target_factor column and where it shows 1, that means the current pga is 9gb, where in the difference is and a rule of thumb the estimated_overalloc_count should always be 0 at your current setting . If not you may need to consider increasing the pga_aggregate_target parameter, So in Good screenshot at size 1 it has 0 estimated_overalloc_count where in the Bad screenshot it shows that 94 times oracle has to do more asking os calls/internal to increase pga. Which is not good. Although pga_aggregate_target parameter if you set at ex: 9gb , if its required session server process will use more than 9gb from os free memory with sysop calls. but if its passing that limit of 9gb it has to fetch from OS free memory and increase estimated overalloc count, if its not able to get free memory then session/server process fails with ora-4030 error, process out of memory error. So pga limit is just a soft limit until 11g, in 12c you can restrict this behaviour with parameter pga_aggregate_limit With above, you might have understood the sizing of pga and sga setting in database is adequate or not, and those historical ones too. This will be a starting point to any of the DBA's to estimate the sga/pga sizing. If you want to understand about specifically buffer_pool and shared_pool advisory you can read from here |
|
| Session/Statement utilization of SGA/PGA ? | v$sgastat
v$pgastat v$process_memory v$process_memory_detail v$sesstat v$active_session_history dba_hist_active_sess_history |
For SGA:-
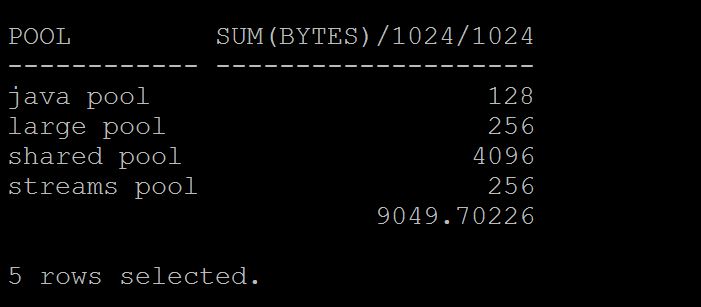
To understand current sizes for each pool in the instance? SQL> select pool,sum(bytes)/1024/1024 from v$sgastat group by pool;
To Understand current free size with in each in the instance? SQL> select pool,name,sum(bytes)/1024/1024 from v$sgastat where name='free memory' group by pool,name;
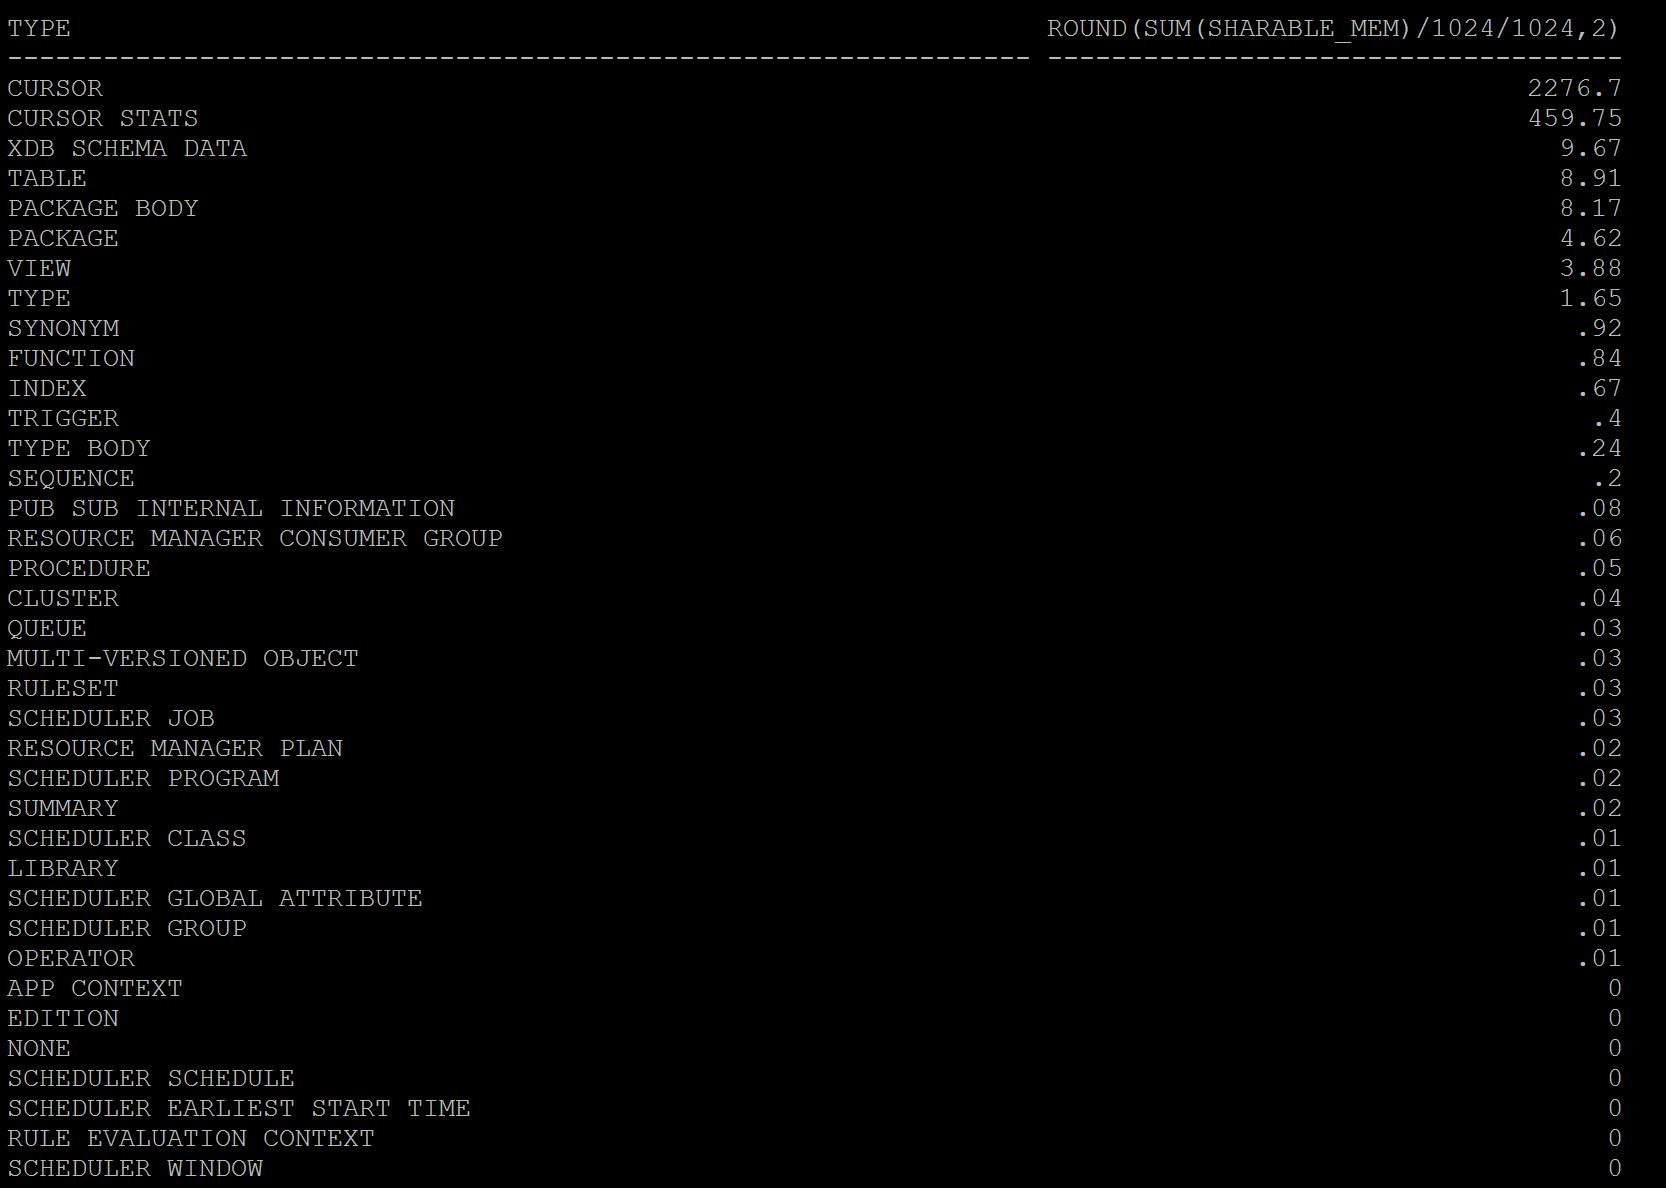
To Understand current utilization of shared pool by each object that occupied, SQL> select type,round(sum(sharable_mem)/1024/1024,2) from v$db_object_cache group by type order by 2 desc;
As you see above cursors i.e plain sql statements using 2.2 gb and cursor statistics taking 450mb of utilization and rest others. So here most of my shared pool utilization is going for simple sql statements. If you want you can further break this query with specific user group by. To understand current utilization by each statement, SQL> select sql_id,sum(sharable_mem) from v$sql where rownum < 100 group by sql_id order by 2 desc;
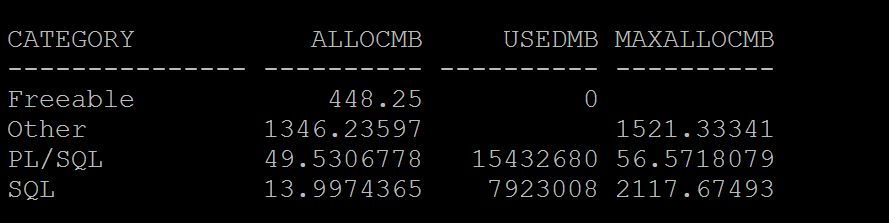
For PGA:- To Understand total Process memory usage overall, SQL> select category,sum(allocated)/1024/1024 AllocMB,sum(used) UsedMB, sum(max_allocated)/1024/1024 MaxAllocMB from v$process_memory group by category;
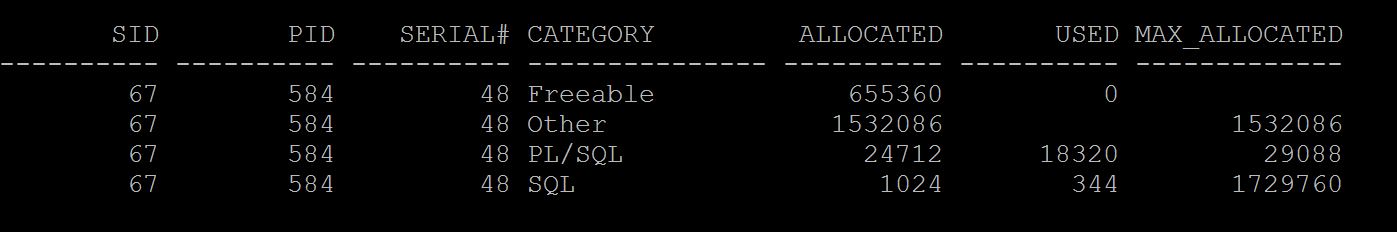
To Understand specific session PGA utilization under which area. SQL> SELECT s.sid,pm.allocated/1024/1024 Alloc_MB, used/1024/1024 UsedMB, Max_allocated/1024/1024 MaxAllocMB FROM v$session s, v$process p , v$process_memory pm WHERE s.paddr = p.addr AND p.pid = pm.pid AND s.sid IN (&1) ORDER BY sid, category;
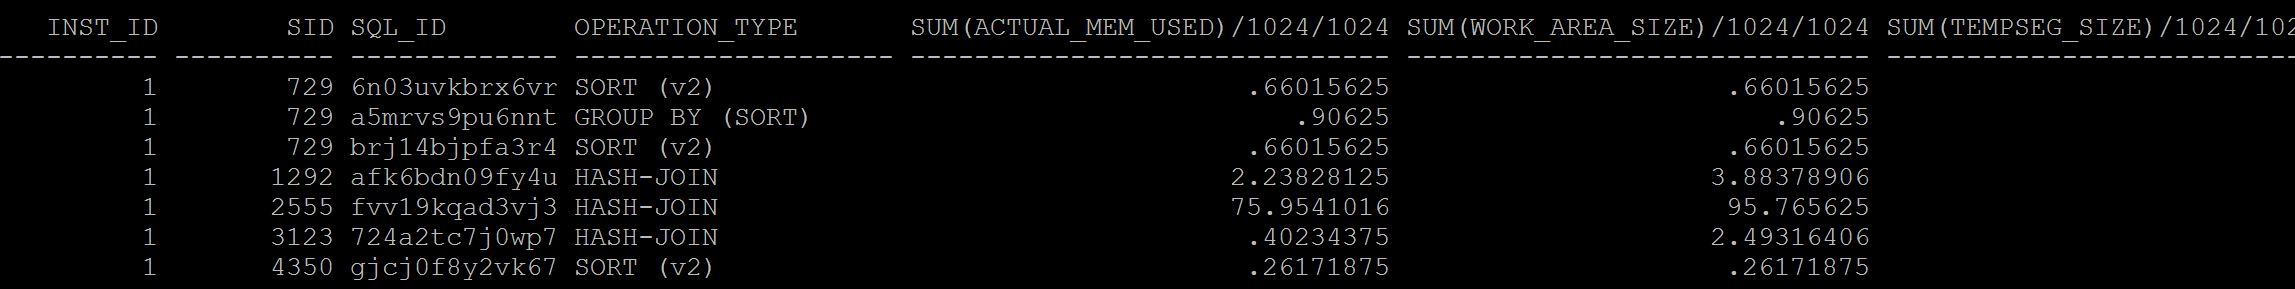
As you see above the majority area goes to Other section of PGA consumption that means, Hash/Sorting etc. We need to understand what causing more pga utilization using workarea active. Work areas are sort area and hash area with in PGA to store the data that need to hash grouped or sorted. SQL> select inst_id,sid,sql_id,operation_type,sum(actual_mem_used)/1024/1024,sum(work_area_size)/1024/1024, sum(tempseg_size)/1024/1024 from gv$sql_workarea_active group by inst_id,sid,sql_id,operation_type;
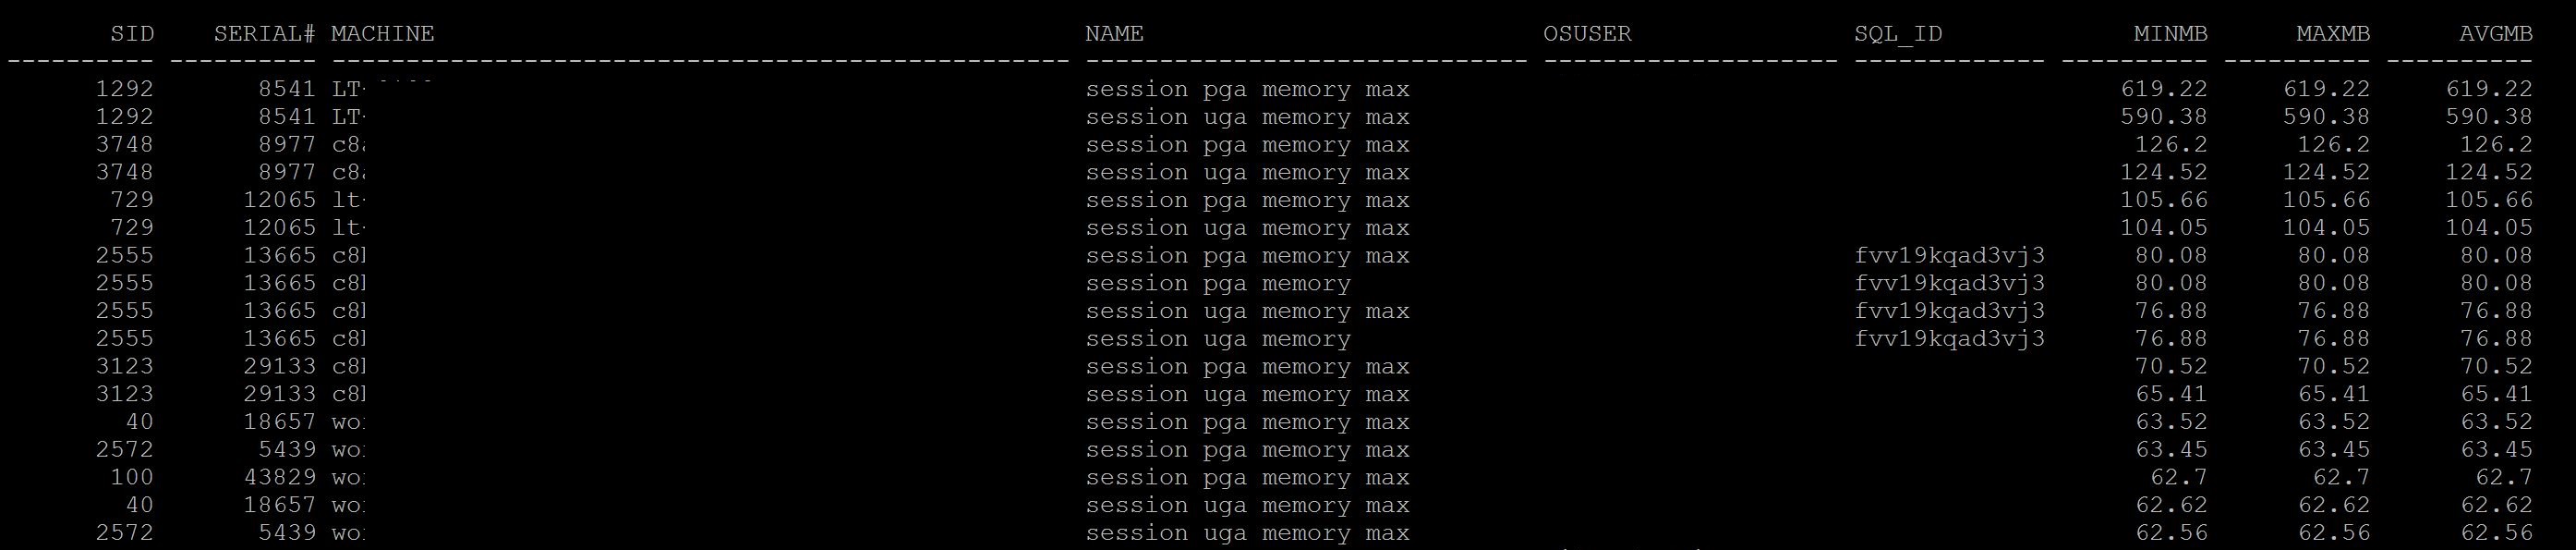
As you see which SID, SQL_ID and which area of workarea i.e hashing or sorting using more PGA can be found easily above. Run the current_pga_by_session.sql also provide the information overall usage for each session as below.
From 11R2 Onwards you can get individual pga allocation from v$active_session_history only. sql> select session_id,event,status,session_state,pga_allocated,temp_space_allocated from v$active_session_history where session_id=''; For Historical you run sql> select session_id,event,status,session_state,pga_allocated,temp_space_allocated from dba_hist_active_sess_history where session_id=&sessionid and snap_id between &BEGIN_SNAP and &END_SNAP; From historical metrics, you can access the pga allocation for each snap by SQL> select snap_id,metric_name,max_val,avg_val from dba_hist_sysmetric_summary where metric_name='Total PGA Allocated'; As you got SQL_ID & SID you can see further where is full table scan is happening and reducing the full scan can eliminate hash area usage thus by pga consumption. And for sorts look out data and if it really needed to keep order by clause. |
|
| Does instance/sessions is experiencing any memory related waits? | v$system_event
v$session v$active_session_history dba_hist_active_sess_history dba_hist_system_event |
If you have inadequate sga or pga there may be some waits that user experience, the following are the most common waits that can visible in wait event column for those sessions.
For SGA:- For Buffer Pool:- free buffer wait, either your buffer pool is inadequate or dbwr is not enough to write quickly to the disk and the session waiting on this wait event to keep their blocks into buffer cache and waiting. For Shared Pool:- latch free or latch: shared pool, these waits will be occur when there is in adequate shared pool allocated to instance and waiting to get an allocation of memory structure to parse query (SQLAREA) For log_buffer:- redo buffer allocation retries, although this pool is not adjusted dynamically and if you less size allocated you will see this wait even its time to increase the log buffer too. For PGA:- direct path read, direct path read direct events appear if there is more PGA is consumed actually its a adverse affect, direct path reads consume pga memory and keep buffers in pga rather sga buffer pool. This is more in 11gr2 which should be addressed properly. Note: latch cache buffer chains, library cache lock, cursor pin x/s, row cache lock, buffer busy wait etc, are related to concurrency issues not memory related waits. Identify Wait Events from Current (V$session/v$active_session_history) or from AWR/Statspack For Current:- |
|
| Common Errors that can be caused by inadequate memory structures | Alert Log
Session/Query Failures |
For Shared Pool:- ora-4031
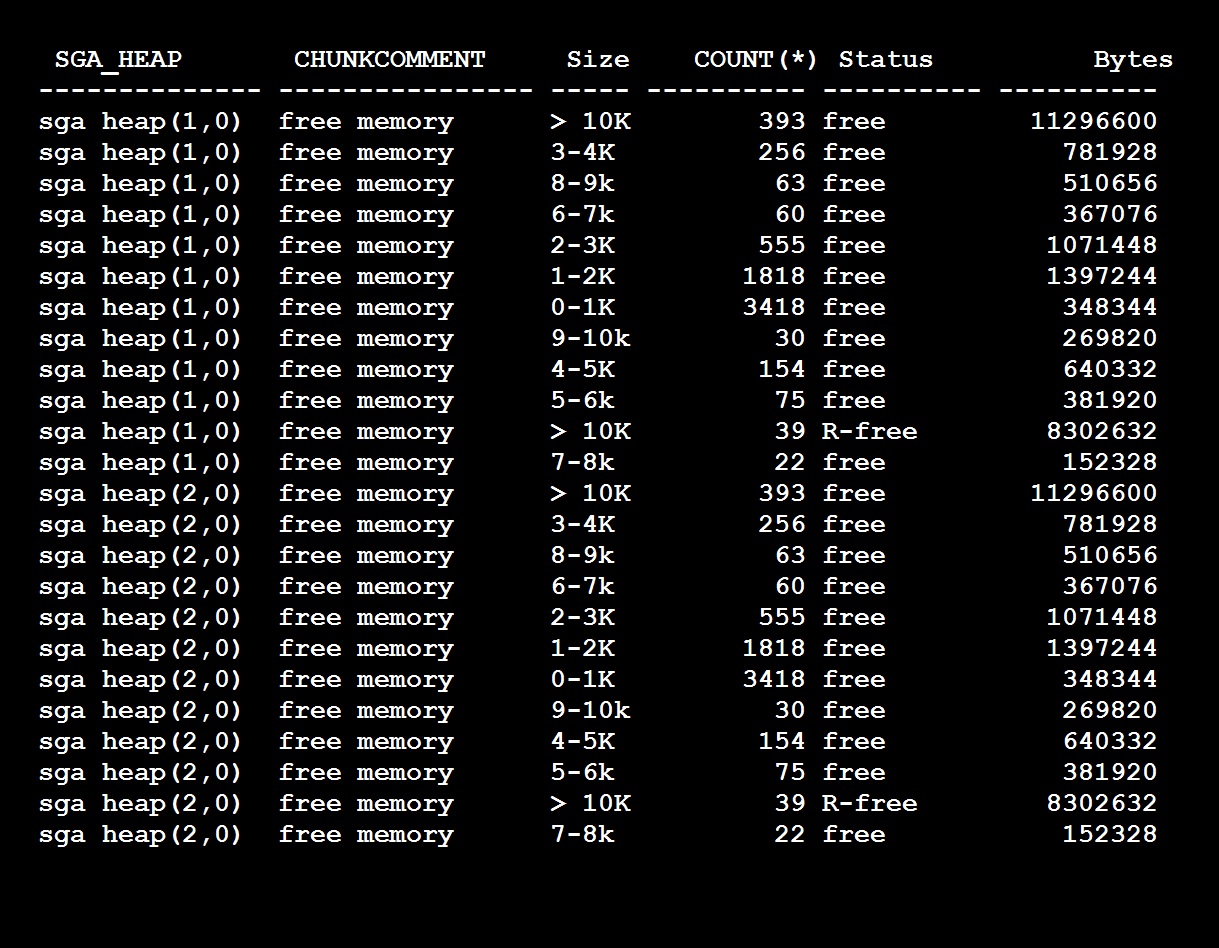
Usually a statement failed or in alert you will see this ORA-04031: "unable to allocate n bytes of shared memory ("shared pool", "object_name", "alloc type(2,0)" ...) Few things note in above line, which pool Shared Pool, object name is namespace in db_object_cache like sql area, plsql or table or which part of shared pool structure it is unable to allocate, and how many bytes it unable to. Generally, whenever a new query is need to parsed that need to obtain a latch for specific size bucket for the query size and memory structure is obtained and parsing will be done. In this process when a memory structure is not available for that query size particularly then its leads to this issue. However small sized shared pool also can lead this since there is no free memory and no latch to obtain therefore no memory structure. Hence query fails. Again, shared pool is divided into multiple subpools with number of buckets with different sizes, you can see this output and query to check in your database shared_pool_buckets.sql
As you see I have two pools (sgaheap(1,0) and sgaheap(2,0) with in shared pool and each pool contains free memory chunks of different sizes and also reserved free memory. So if my query requires for example 4K chunk and it can go to any pool and obtain the free chunk out of it. As many queries fire against of same size and 4K chunk is 0 then if any other query goes to pool 1 and there is no free chunk available it fails with ora-4031 unable to allocate 4096 bytes (sqlarea.....) like this. Unfortunately, even if you have pool 2 having 4k Chunk it will not allocated to the failed query. Since your query has acquired a latch for pool 1. How to resolve it, So first identify whether your shared pool has free memory with in pool, SQL> select pool,name,sum(bytes)/1024/1024 from v$sgastat where name='free memory' group by pool,name;
So as such you have free memory available even still the query is failing means you got the above issue, i.e shared pool fragmentation, since the shared pool is divided into multiple pools and the free chunks are distributed evenly/proportionally to the pools. This is required to reduce the waiting on long list of latch and introduced from 8i I think. Again, unluckily there is no hard fact rule how many pools you need for a given sized shared pool, so its upto you how many pools you need, try to reduce the pools to the average, for example give a size of shared pool about 10g you may have 2 to 3 pools, if so try to reduce to 2. Note:- Do not reduce to 1 never, this may cause another issue long waiting of latching queue. since there is only one pool and latch list will be long and hence parsing time will be more (indirectly CPU consumption). How to check how many pools and the parameter, SQL> select distinct ksmdsidx from x$ksmss; KSMDSIDX ---------- 1 2 SQL> Show parameter _kghdsidx_count 2 Note: Changing this parameter may need bounce For PGA - ora-4030 ora-4030 , out of process memory, There are numerous possibilities for this issue, however in an normal running system and no issues before, the following may be the cause 1. Inadequate free memory at OS If you see more resize operations like PGA_TARGET GROW always then the PGA is inadequate and you must increase the PGA or try to reduce the following. Secondly, Identify where PGA utilization is more, SQL> select category,sum(allocated)/1024/1024 AllocMB,sum(used) UsedMB, sum(max_allocated)/1024/1024 MaxAllocMB from v$process_memory group by category;
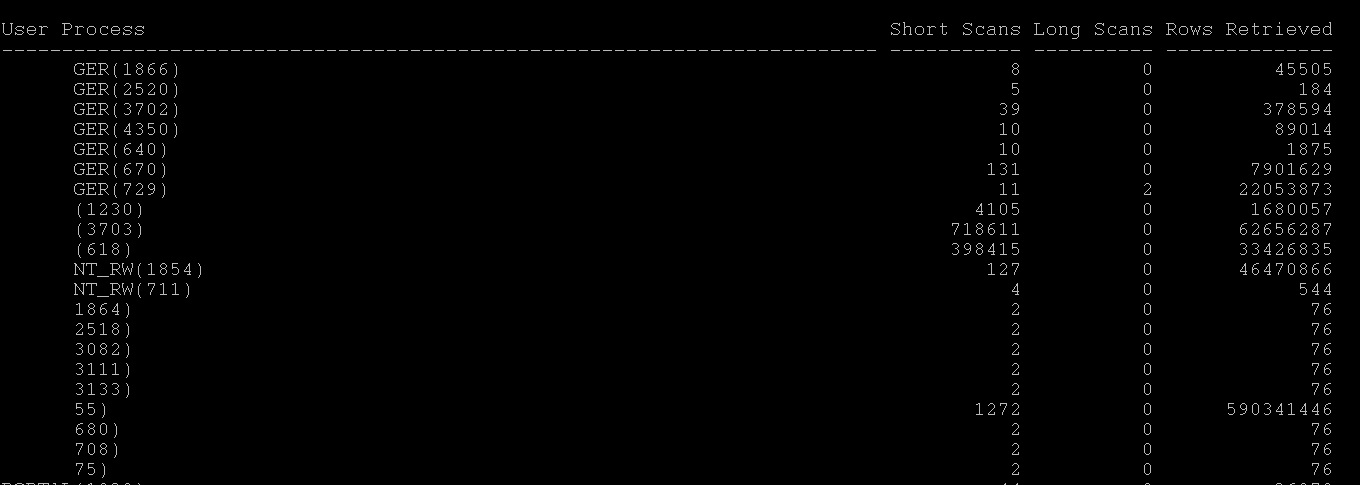
1. More hash joins i.e more full table scans. Identify the tables/statements that involved in tablescans_by_session.sql fulltable_scans_statements.sql
2. More direct path reads, Identify tables that are involved in direct path reads which consume pga (11gr2) and avoid full tablescans on them 3. More Sorting, identify which statement having more sorts |
|
| Improving Shared Pool Efficiency | v$sqlstat
v$sqlarea v$library_cache_memory v$sql_shared_pool |
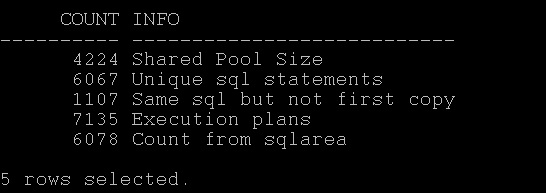
First understand how is your shared pool utilization, SQL> select round(bytes/(1024*1024),0) count, 'Shared Pool Size' info from v$sgainfo where name = 'Shared Pool Size' union all select count(*), 'Unique sql statements' from v$sql_shared_cursor where child_number = 0 union all select count(*), 'Same sql but not first copy'from v$sql_shared_cursor where child_number >= 1 union all select count(*), 'Execution plans' from v$sql_shared_cursor union all select count(*), 'Count from sqlarea' from v$sqlarea;
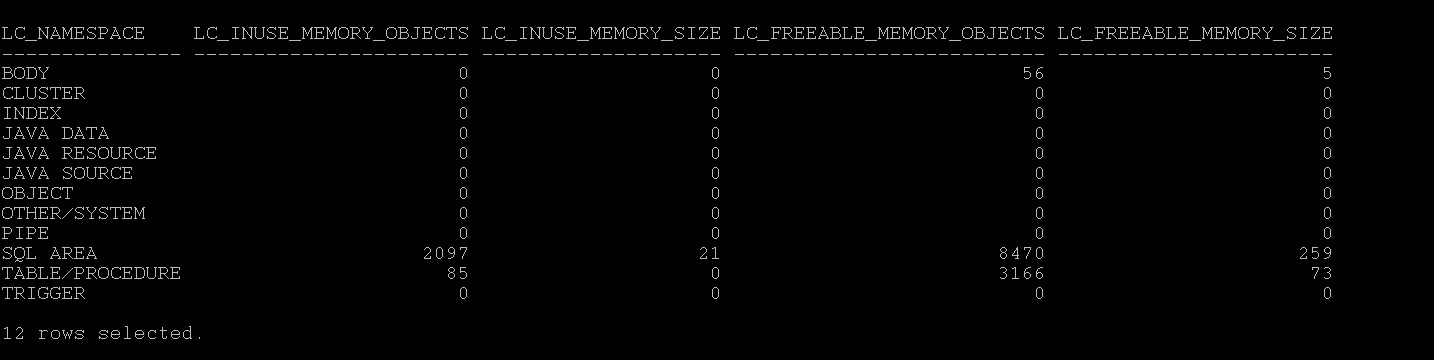
As you see, the database is more unique statements than common statements and closer number of executions plans observed too. That means this database is firing more unique statements and cannot be shared. Secondly, how is library cache utilization under which namespace, SQL> select * from v$library_cache_memory;
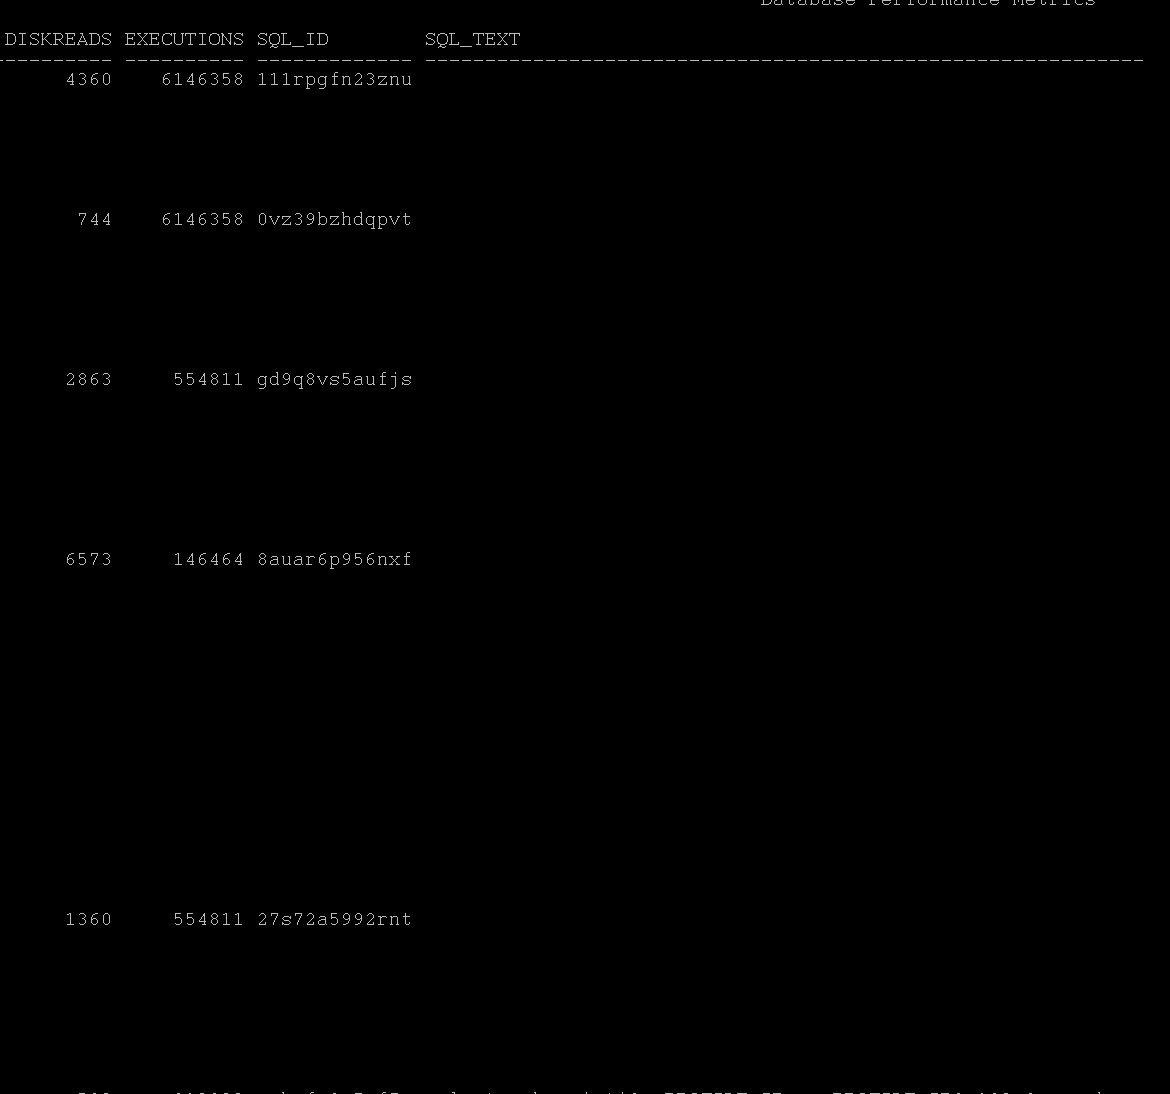
As we observed above the library is used mostly in sqlarea i.e cursors or statements not the others. Solution:-1 1. Sharing your cursors at application level, if not possible at DB level with cursor_sharing=force or similar , read here 2. If you see in time model statistics the soft parse is taking more time, then increase session_cached_cursors and cursor_space_for_time=true. at parameter level. (mostly you will be seeing library cache lock and library cache latch or cursor pin s etc as wait events for this sessions) 3. Identify the plans that frequently changing by using sql_plan_changes.sql and fix them with profile may help. 4. Reduce the DDL while DML is running/batches or running to avoid more invalidations, like statistics collection, partition maintenance Run this query it will give overall picture of shared pool utilization of top 5 statements in terms of disk/buffer/memory/cpu/executions:- current_expensive_queries.sql |
|
| Improving Buffer Pool Efficiency | v$bh
v$buffer_pool x$bh |
First understand how many buffers you have in the buffer pool at the moment.
SQL> SELECT name, block_size, SUM(buffers) FROM V$BUFFER_POOLGROUP BY name, block_size HAVING SUM(buffers) > 0; NAME BLOCK_SIZE SUM(BUFFERS) -------------------- ---------- ------------ DEFAULT 8192 1174567 Second identify which object taking more buffer pool usage buffer_pool_top_object.sql
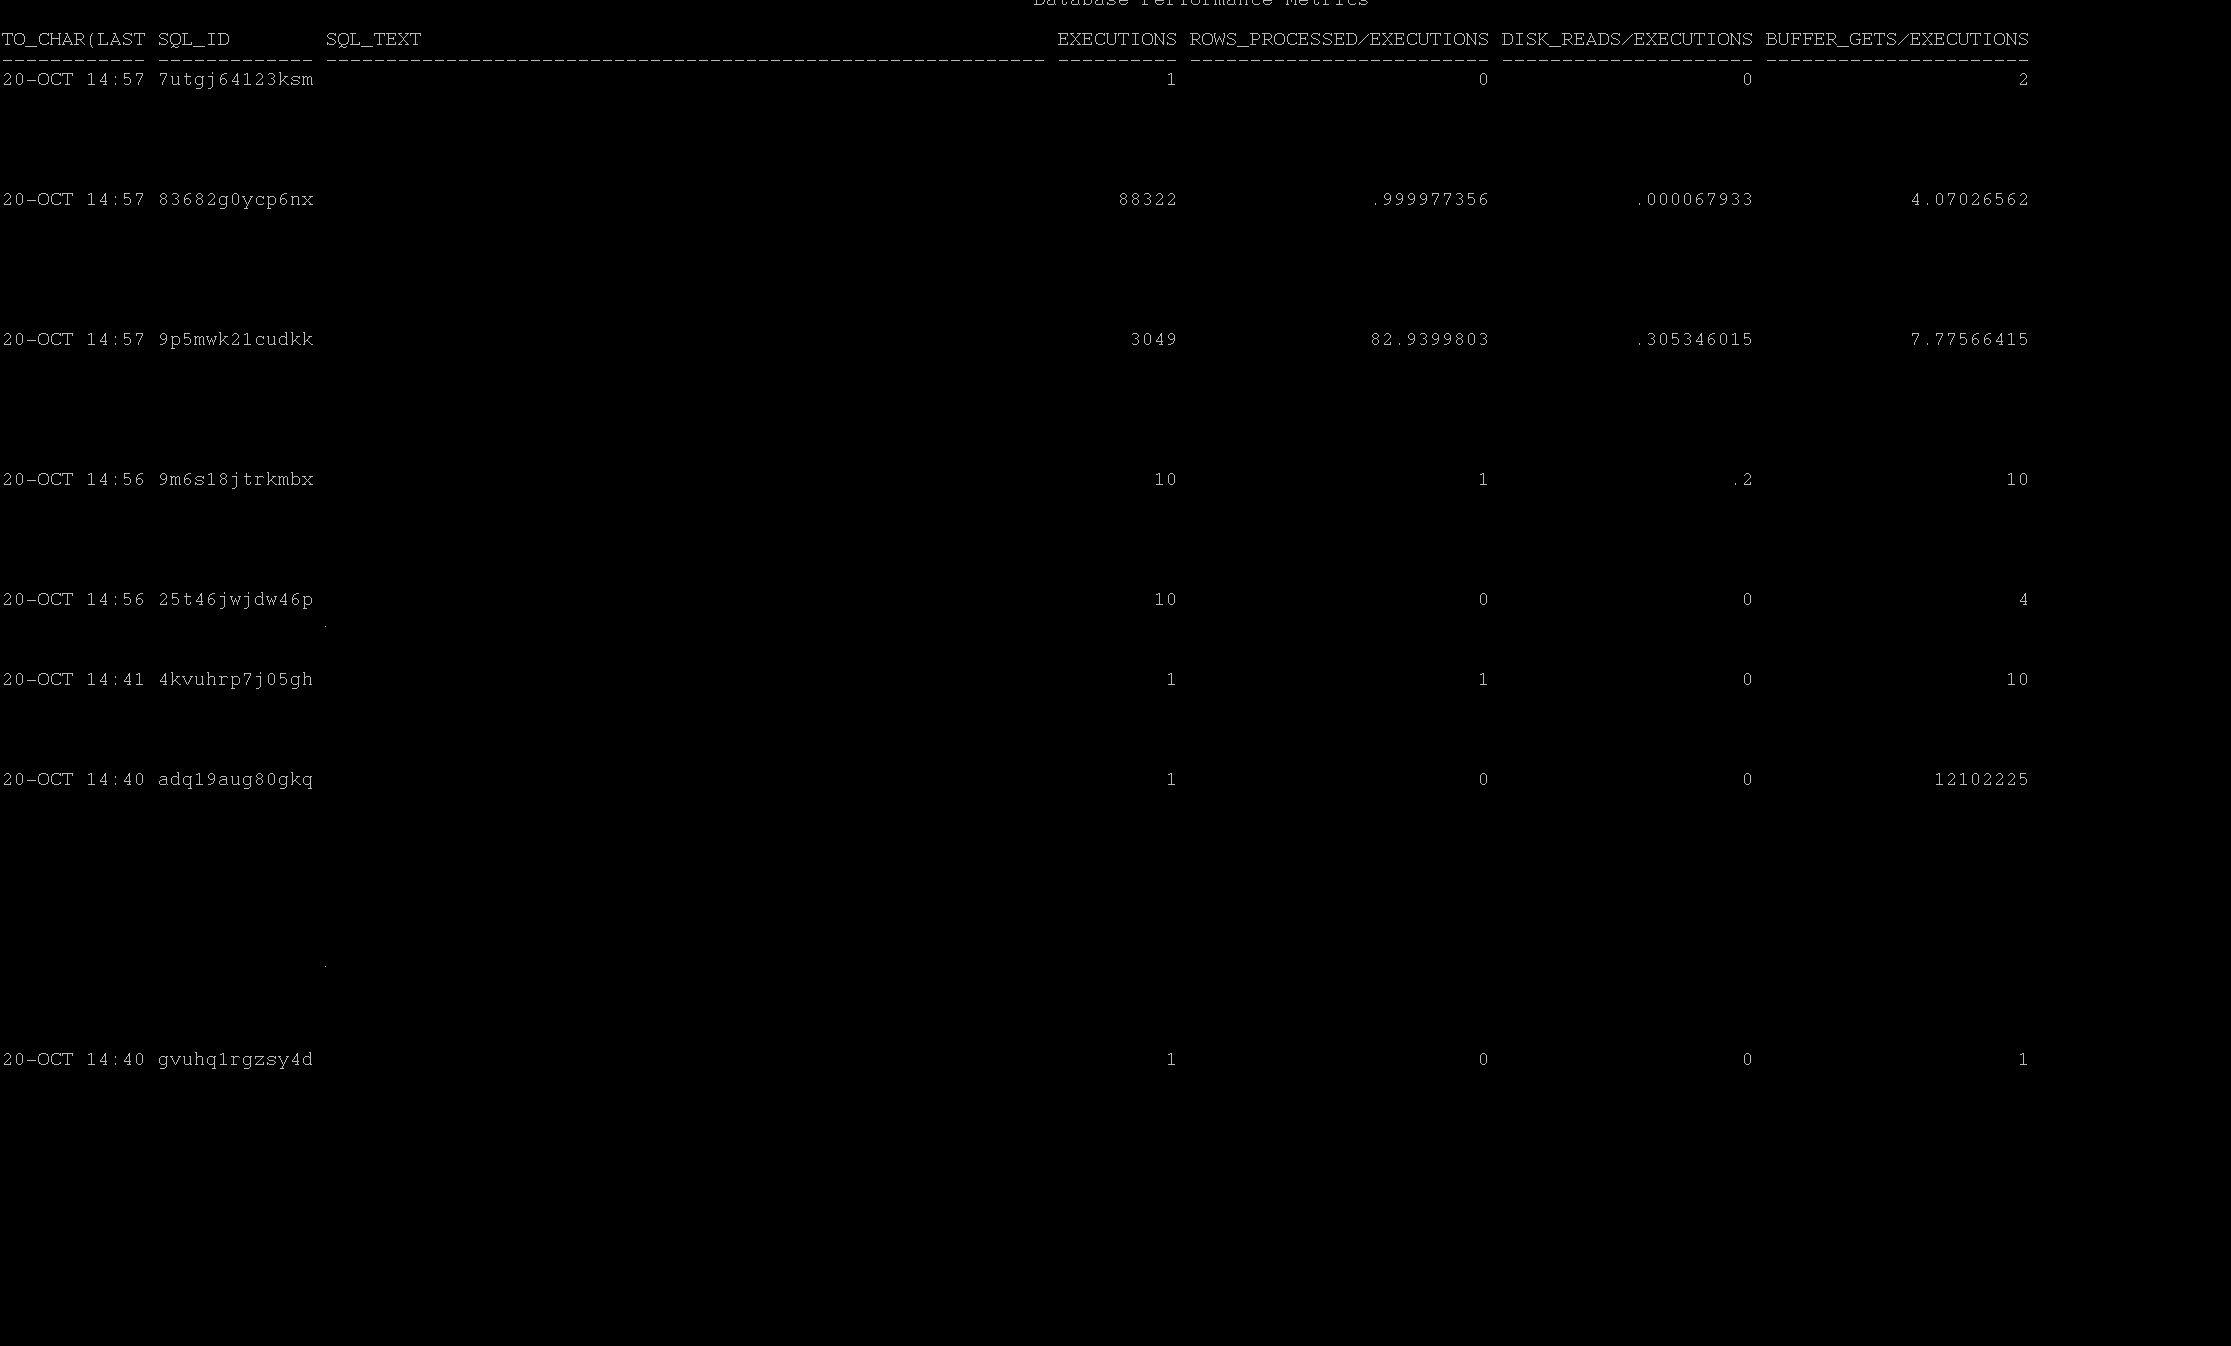
Next, identify those statements which consuming more memory with in buffer pool and check those execution plan, Again if full tablescans happening try to reduce them or may be check the logic or may increase the buffer pool. SQL> select to_char(last_active_time,'DD-MON HH24:MI'), sql_id,sql_text,executions,rows_processed/executions, disk_reads/executions,buffer_gets/executions from v$sql where sql_text like '%&top_table_above_in_buffer_pool%' order by last_active_time,buffer_gets;
|
Hi, Thank you for the post.
unfortunatley, I am unable to read the complete portion ( right side ) of the post. The Description column text is cut off and only half of it is visible to read. I tried all browsers and did not help. Can you please correct it if possible. Appreciate your efforts in giving great information.
Hey Krishna
Thanks so much. I haven’t looked at the blog preview in 100% thinking that font is okay, now I corrected it. Please let me know if you still face any issue
-Thanks
hi could you post sql_plan_changes.sql script.
HI
This will help
set lines 500
set pages 500
col Snap for a25
col SQL_PROFILE for a40
select distinct b.BEGIN_INTERVAL_TIME as Snap,a.PLAN_HASH_VALUE as Plan,a.EXECUTIONS_DELTA as EXECUTIONS,
a.ELAPSED_TIME_DELTA/1000000 as ELAPSED_sec,a.ROWS_PROCESSED_DELTA as “Rows”,a.ROWS_PROCESSED_DELTA/CASE WHEN a.EXECUTIONS_DELTA = 0
THEN -1 ELSE a.EXECUTIONS_DELTA END “Avg Rows”,a.ELAPSED_TIME_DELTA/1000000/CASE WHEN a.EXECUTIONS_DELTA = 0 THEN -1
ELSE a.EXECUTIONS_DELTA END “Avg Elapsed”,a.optimizer_cost,a.SQL_PROFILE
from DBA_HIST_SQLSTAT a,DBA_HIST_SNAPSHOT b where a.SQL_ID =’&sqlid’ and
a.snap_id = b.snap_id order by b.BEGIN_INTERVAL_TIME;