Hello,
Very long back, Karlarao has written a wonderful script which delivers a exhaustive report for database performance. The script extracts the data from AWR repository tables.
Where in I have took liberty to tweak the same script for those who does not have AWR licensing and having statspack only.
Here is the script that can be run on statspack which generates similar report for database load representation. If you want to identify the database load from AWR report , you will need to generate multiple reports compare etc , but this report give you a glance of each snap and its respective load in terms of CPU/MEM/IO etc.
Script for Statspack Version:- statpack_gen_wl.sql
Script for AWR Version:- awr_gen_wl.sql
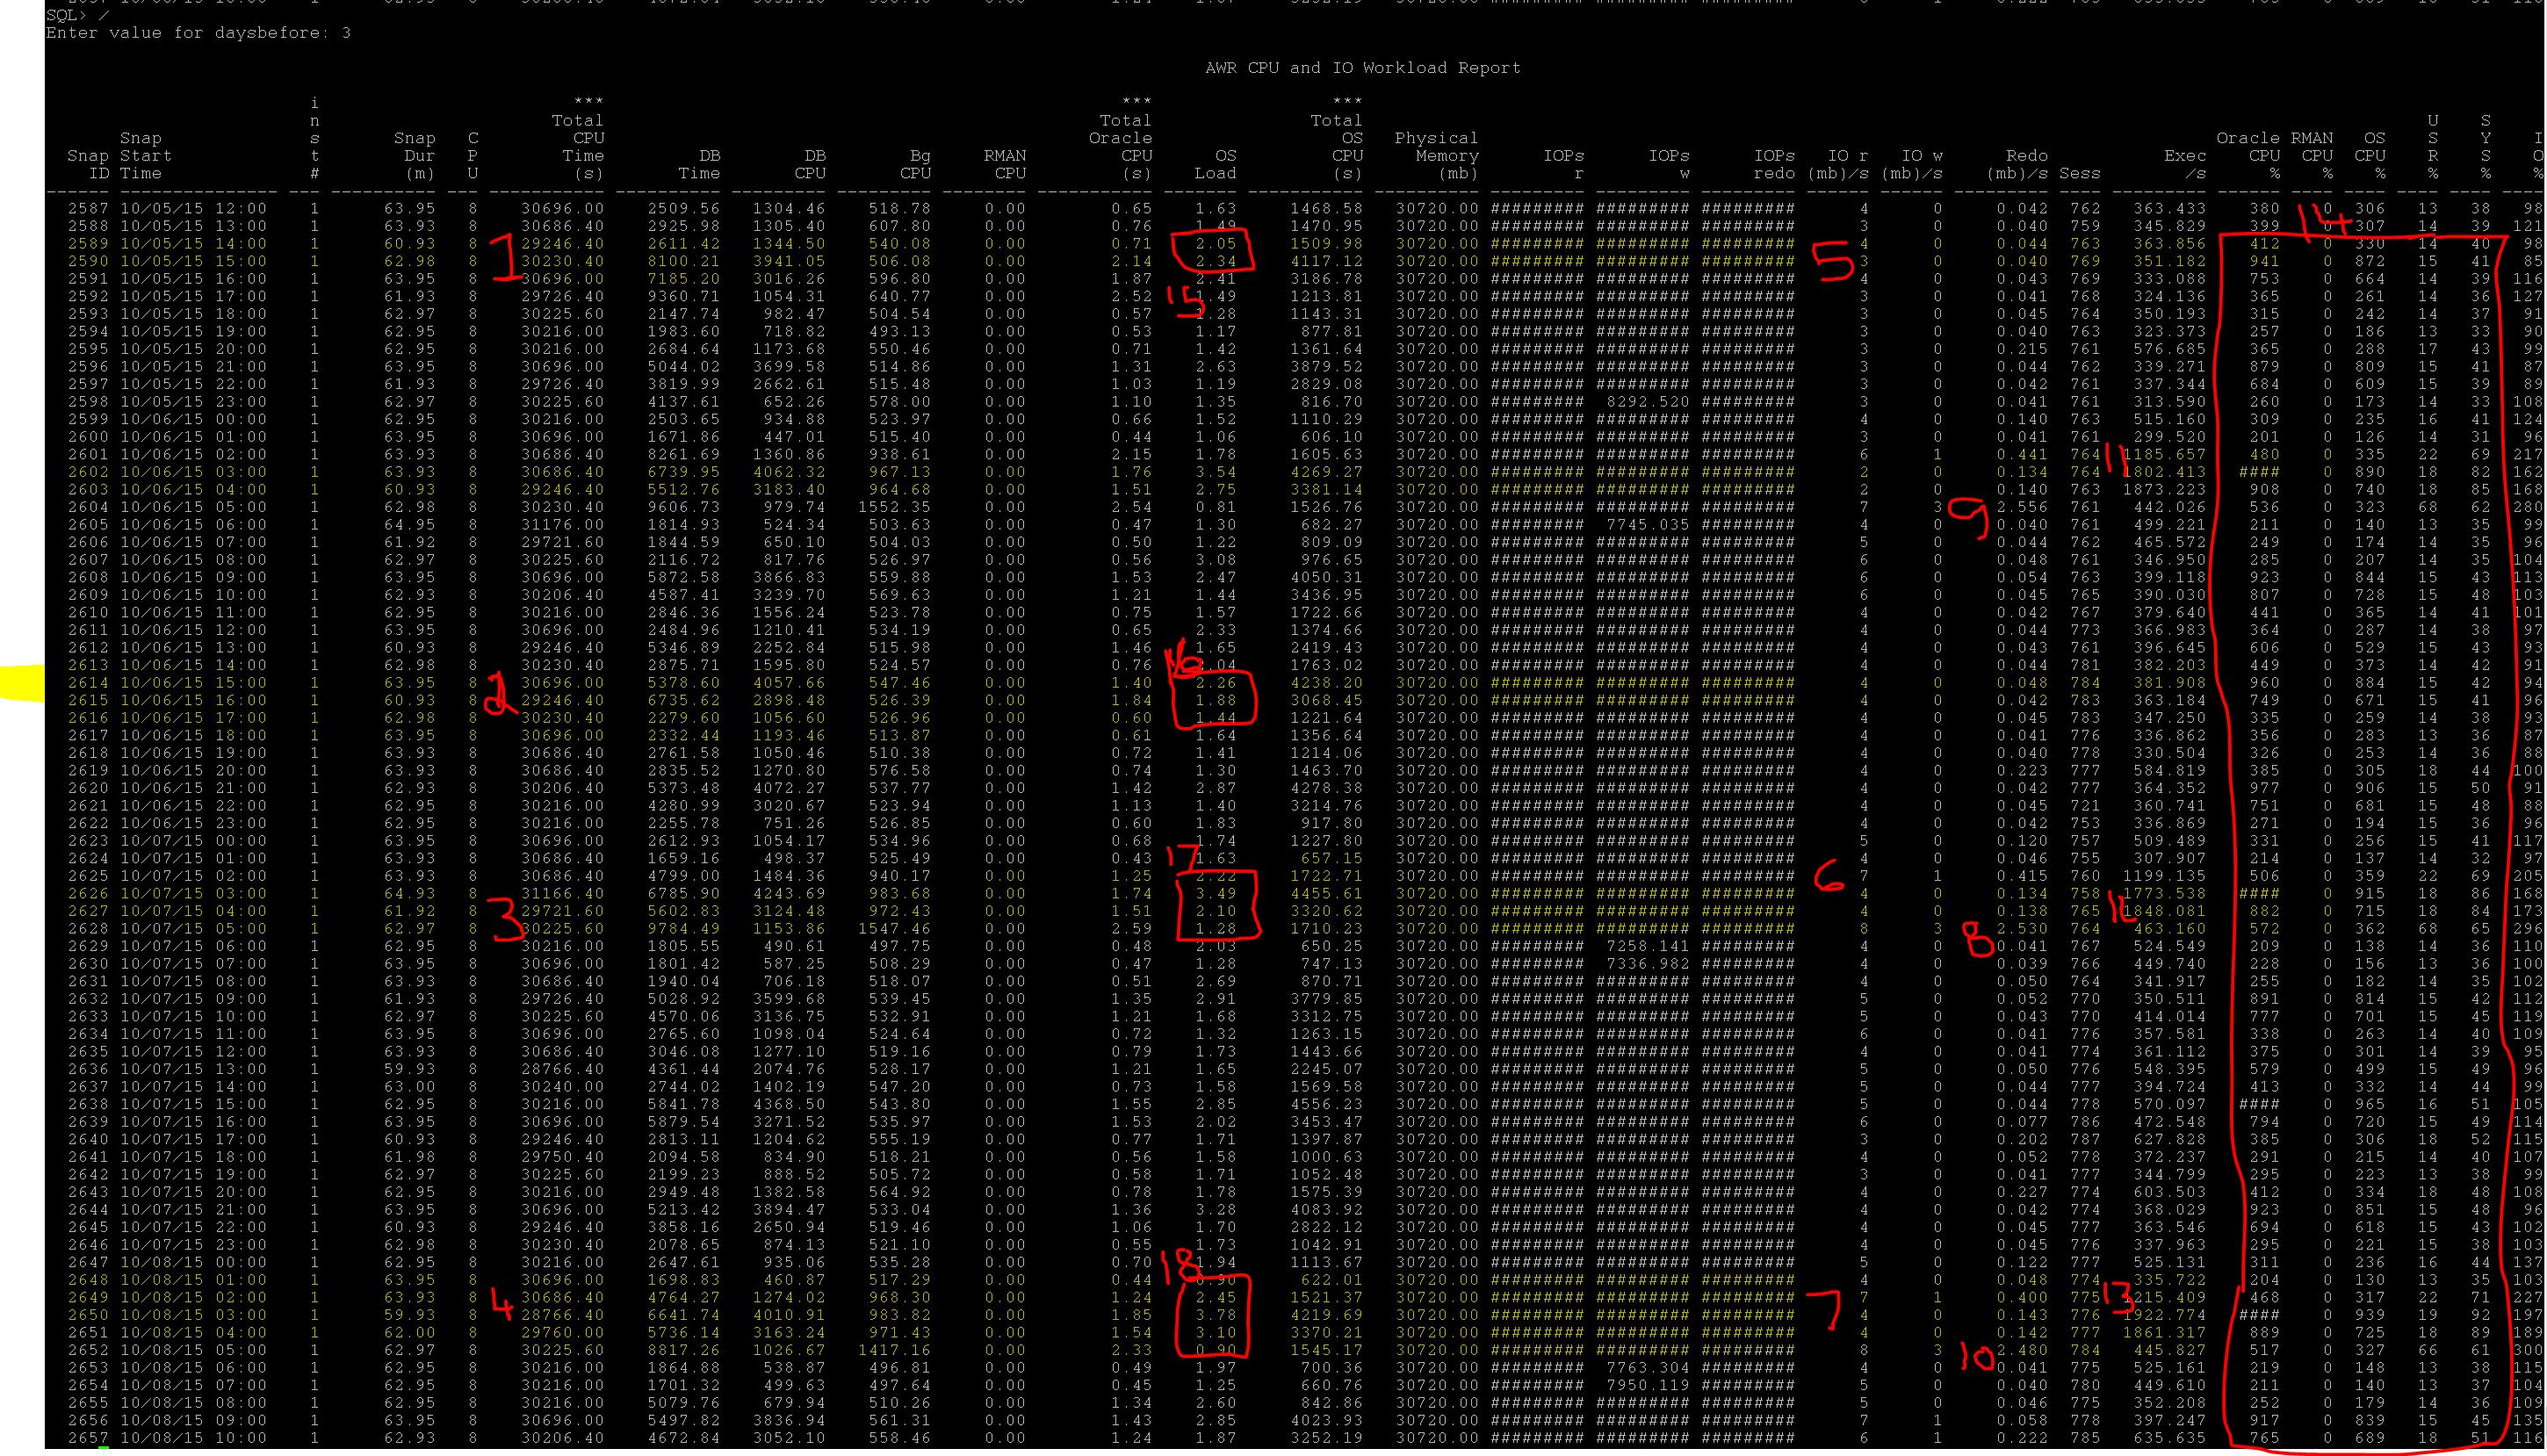
Report Screenshot (Click to enlarge)
Alongside, here is the notes, Lets try to understand the report too. I have highlighted the important sections so that you can also look at your database performance.
1. Looking at 1,2,3,4, you can understand where is the most DB time utilized.
2. Looking at 5,4,6,7, you can understand that your database has more I/O utilization at that time.
3. Looking at 8,9,10, about redo , how much redo the database has generated. With this you can understand easily is there any DML activity happened at that time.
4. Looking at 11,12,13, about executions, we can cleverly know that database is doing more executions at what time also this tells you if you experience any memory contention in shared pool. Like ora-4031 errors just in case reporting or more cursors opened etc.
5. Looking at 14, the big box, we can divide the CPU load whether its RMAN, Oracle, OS CPU utilization and also in percentages of User or SYS user, which you can determine any backups running during that time etc or any SYS level activity to rule out maintenance stuff.
5. Looking at 15,16,17,18, you can understand OS load too
Well isnt it this report is cooler (except this will not tell you about ) than AWR (2 hours snap) to look at glance of database over period.
Hope this is useful.

[…] is the second part in the series of Performance Troubleshooting, Whilst the first one is from AWR/Statspack […]
[…] First Post, http://db.geeksinsight.com/2015/10/08/performance-troubleshooting-series-understanding-your-oracle-d… […]
[…] Looking at identifying Database Load in previous posts (Post 1,Post 2) and seeing where the database time spending much (Post 3). Its time to check out how I/O is […]
[…] parts in the series we have covered, DB Load Profile, DB Load Profile2, Time Model, IO […]
[…] Part 1 and Part 2 of the Series […]
[…] Part 1 and Part 2 of the […]