Subscribe to Posts by Email

Subscriber Count

    703

Disclaimer

All information is offered in good faith and in the hope that it may be of use for educational purpose and for Database community purpose, but is not guaranteed to be correct, up to date or suitable for any particular purpose. db.geeksinsight.com accepts no liability in respect of this information or its use. This site is independent of and does not represent Oracle Corporation in any way. Oracle does not officially sponsor, approve, or endorse this site or its content and if notify any such I am happy to remove. Product and company names mentioned in this website may be the trademarks of their respective owners and published here for informational purpose only. This is my personal blog. The views expressed on these pages are mine and learnt from other blogs and bloggers and to enhance and support the DBA community and this web blog does not represent the thoughts, intentions, plans or strategies of my current employer nor the Oracle and its affiliates or any other companies. And this website does not offer or take profit for providing these content and this is purely non-profit and for educational purpose only. If you see any issues with Content and copy write issues, I am happy to remove if you notify me. Contact Geek DBA Team, via geeksinsights@gmail.com

Pages

Oracle Cursor Sharing Examples

In the previous post we discussed about the Parent & Child Cursors in Oracle and how do they work or shared.

To get into deeper, Oracle controls the sharing of cursors with parameter called cursor_sharing. It has three values

  • EXACT
  • SIMILAR
  • FORCE

    In this post we will create a table which has some records with different data skewness, and we will experiment with above three values.

Test environment:-

<pre>

-- create a test table with
1 record with id1 = id2 = 1
1000 records with id1 = id2 = 2
2000 records with id1 = id2= 3

-- create an index on the table

HR> drop table test purge;
create table test (id1 number, id2 number, txt char(1000));
insert into test values (1,1, 'one');
begin
for i in 1..1000 loop
insert into test values (2,2, 'two');
insert into test values (3,3, 'three');
end loop;
end;
/
insert into test select * from test where id1=3;
commit;
create index test_idx1 on test(id1);
create index test_idx2 on test(id2);
select id1,id2, count(*)
from test
group by id1,id2;

Let's experiment with different values :-

</pre>

CURSOR_SHARING = EXACT

In this case when the same statement is issued with different literals, multiple parent cursors will be created.

<pre>

Parent   Parent  Parent
    |          |          |
Child    Child      Child

-- Flush the shared pool
-- Set cursor_sharing=exact

SYS>alter system set CURSOR_SHARING='EXACT';
SYS>alter system flush shared_pool;
SYS>sho parameter CURSOR_SHARING

NAME                                 TYPE        VALUE
-----                                ----        -----
cursor_sharing                       string      EXACT

-- Issue identical statements with different values of literals

HR>conn hr/hr
select count(*) from test where id1=1;
select count(*) from test where id1=2;
select count(*) from test where id1=3;

SYS>col sql_text for a30 word_wrapped
         SELECT SQL_TEXT , SQL_ID, VERSION_COUNT, HASH_VALUE,PLAN_HASH_VALUE
         FROM V$SQLAREA
         WHERE LOWER(SQL_TEXT) LIKE 'select count(*) from test%'
              AND LOWER(SQL_TEXT) NOT LIKE '%HASH%';

SQL_TEXT                       SQL_ID        VERSION_COUNT HASH_VALUE    PLAN_HASH_VALUE
------------------------------ ------------- ------------- ----------    ---------------
select count(*) from test      1n09m564gh0q3             1 2297955011    4192825871
where id1=3
select count(*) from test      20nhaap8uxf7s             1 1370405112    3507950989
where id1=2
select count(*) from test      bavqx2mw26wg0             1 4163072480    3507950989
where id1=1

-- Note that 3 child cursors have been created for the 3 statements

SYS>col child_number for 99
SELECT SQL_TEXT, SQL_ID, CHILD_NUMBER CHILD#, HASH_VALUE, PLAN_HASH_VALUE
FROM V$SQL
WHERE LOWER(SQL_TEXT) LIKE 'select count(*) from test%'
AND LOWER(SQL_TEXT) NOT LIKE '%HASH%';

SQL_TEXT                       SQL_ID            CHILD# HASH_VALUE    PLAN_HASH_VALUE
------------------------------ ------------- ---------- ----------    ---------------
select count(*) from test      1n09m564gh0q3          0 2297955011    4192825871
where id1=3
select count(*) from test      20nhaap8uxf7s          0 1370405112    3507950989
where id1=2
select count(*) from test      bavqx2mw26wg0          0 4163072480    3507950989
where id1=1

</pre>

Observations:-

There is one record for each statement in v$sqlarea as one parent cursor is created for each sql statement since each of these statements differ in their text.

Each statement has different SQL_ID/HASH_VALUE

There is one child per parent cursor (version_count=1)

Execution plans for id = 2,3 is same (full table scan) (same PLAN_HASH_VALUE)

Execution plan for id = 1 is different (indexed access)

Points to ponder :-

Each of the cursor occupies memory. Parent cursors contain sql text whereas child cursor contains execution plan, execution statistics and execution environment. If we replace literal with a bind variable, all the 3 statements will be identical and hence only parent cursor needs to be created. Multiple child cursors can be created for different values of the bind variables.

That's what CURSOR_SHARING=SIMILAR does. It replaces literals in the otherwise identical SQL statements with bind variables and only one parent cursor is

created.

  • If histogram on a column is created with only one bucket,i.e. it does not know about the skew in data, only one child cursor will be created.
  • If histogram is created on a column with >1 buckets i.e. it knows about skew in data in that column, it  will create one child cursor for each statement even of the execution plan is same.

Thus CURSOR_SHARING=SIMILAR reduces the no. parent cursors. which means reduce the usage of shared pool.

Notes:-

If there is skew in data

If histogram on the column containing skewed data is there multiple child cursors may be created - one for each value of the bind variable

  else (histogram is not available)

      only one child cursor will be created.

  else (Data is not skewed)

      only one child cursor will be created.

Now in our example table, since there is identical skewed data in id1 and id2 , we will create histogram  on id1 with one bucket and on id2 with 4 buckets and see the difference.

CURSOR_SHARING=SIMILAR WITHOUT HISTOGRAM

A parent and child will be created
Parent  
  |        
Child    
-- create histogram only on id1 with one bucket so that optimizer does not know about the skew --

HR>exec dbms_stats.gather_table_stats(OWNNAME => 'HR',-
                                      TABNAME => 'TEST',-
                                      ESTIMATE_PERCENT =>null,-
                                      METHOD_OPT => 'FOR COLUMNS SIZE 1 ID1');
Note: method_opt in dbms_stats if the columns size is 1 that means no histograms
-- Set cursor_sharing = similar
-- Flush the shared pool
-- Issue identical statements with different values of literals for the column 
   on which histogram is not there (id1)

SYS>alter system set CURSOR_SHARING='SIMILAR';
SYS>alter system flush shared_pool;
SYS>sho parameter CURSOR_SHARING

HR>conn hr/hr
select count(*) from test where id1=1;
select count(*) from test where id1=2;
select count(*) from test where id1=3;

Check that the only 1 parent cursor has been created and literal has been replaced by bind variable. ( 1 record in v$SQLAREA)

There is only one child  cursor (version_count=1) since the optimizer does not know about skew in data

SYS>col sql_text for a30 word_wrapped
         SELECT SQL_TEXT , SQL_ID, VERSION_COUNT, HASH_VALUE,PLAN_HASH_VALUE
         FROM V$SQLAREA
         WHERE LOWER(SQL_TEXT) LIKE 'select count(*) from test%'
              AND LOWER(SQL_TEXT) NOT LIKE '%HASH%';

SQL_TEXT                       SQL_ID        VERSION_COUNT HASH_VALUE PLAN_HASH_VALUE
------------------------------ ------------- ------------- ---------- ---------------
select count(*) from test      07tpk6bm7j4qm             1 3866661587 3507950989
where id1=:"SYS_B_0"

-- Note there is only one child cursor created 
i.e. same execution plan will be used for different values of the bind variable

SYS>col child_number for 99
         SELECT SQL_TEXT, SQL_ID, CHILD_NUMBER CHILD#, HASH_VALUE, 
                       PLAN_HASH_VALUE
         FROM V$SQL
         WHERE LOWER(SQL_TEXT) LIKE 'select count(*) from test%'
             AND LOWER(SQL_TEXT) NOT LIKE '%HASH%';

SQL_TEXT                       SQL_ID            CHILD# HASH_VALUE PLAN_HASH_VALUE
------------------------------ ------------- ---------- ---------- ---------------
select count(*) from test      07tpk6bm7j4qm          0 3866661587 3507950989
where id1=:"SYS_B_0"

This is called bind peeking, Optimizer does not aware of data skewness and opts same plan for all executions, this was addressed in 11g with Adaptive Cursor sharing.

CURSOR_SHARING=SIMILAR  WITH HISTOGRAM

	Parent
	  +
   +---+----+--------+
   |        |        |
  Child    Child    Child

--create histogram  on id2 with  4 buckets 
  so that optimizer knows about the skew in data

HR>exec dbms_stats.gather_table_stats(OWNNAME => 'HR',-
                                      TABNAME => 'TEST',-
                                      ESTIMATE_PERCENT =>null,-
                                      CASCADE => TRUE,-
                                      METHOD_OPT => 'FOR COLUMNS SIZE 4 ID2');  

--Issue identical statements with different values of literals 
  for the column on which histogram is there (id2)

SYS>alter system flush shared_pool;

HR>conn hr/hr
select count(*) from test where id2=1;
select count(*) from test where id2=2;
select count(*) from test where id2=3;

-- Check that the only 1 parent cursor has been created 
   and literal has been replaced by bind variable. ( 1 record in v$SQLAREA)
   Observe, there are 3 child cursors (version_count=3)

SYS>col sql_text for a30 word_wrapped
         SELECT SQL_TEXT , SQL_ID, VERSION_COUNT, HASH_VALUE,PLAN_HASH_VALUE
            FROM V$SQLAREA
         WHERE LOWER(SQL_TEXT) LIKE 'select count(*) from test%'
             AND LOWER(SQL_TEXT) NOT LIKE '%HASH%';

SQL_TEXT                       SQL_ID        VERSION_COUNT HASH_VALUE	PLAN_HASH_VALUE
------------------------------ ------------- ------------- ----------	---------------
select count(*) from test      3tcujqmqnqs8t             3 3981140249	2432738936
where id2=:"SYS_B_0"

--Note that 3 child cursors have been created as optimizer realizes 
  that data is skewed and different execution plans 
  will be more efficient for different values of the bind variable.
-- 2 children have same execution plan (PLAN_HASH_VALUE) 
   (for id=2 and 3(Full table scan )  

SYS>col child_number for 99
    SELECT SQL_TEXT, SQL_ID, CHILD_NUMBER CHILD#, HASH_VALUE,PLAN_HASH_VALUE
     FROM V$SQL
    WHERE LOWER(SQL_TEXT) LIKE 'select count(*) from test%'
        AND LOWER(SQL_TEXT) NOT LIKE '%HASH%';

SQL_TEXT                       SQL_ID            CHILD# HASH_VALUE	PLAN_HASH_VALUE
------------------------------ ------------- ---------- ----------	---------------
select count(*) from test      3tcujqmqnqs8t          0 3981140249	2432738936
where id2=:"SYS_B_0"
select count(*) from test      3tcujqmqnqs8t          1 3981140249	2432738936
where id2=:"SYS_B_0"
select count(*) from test      3tcujqmqnqs8t          2 3981140249	1489241381
where id2=:"SYS_B_0"

Observations:- Hence, it can be seen that setting CURSOR_SHARING=SIMILAR

  • replaces literals with bind variables in otherwise identical sql statements
  • Only one child cursor is created if optimizer does not know about skew in  data
  • If optimizer is aware of the skew in data, Multiple child cursors are created for each distinct value of the bind variable even if they have the same executiion plan.
    Points to ponder here:-

    Ideally we would like one child cursor to be created if execution plan is same for different values of the bind variable.

    Setting CURSOR_SHARING=FORCE IN 11G does precisely this but only if the optimizer is aware about the skew in the data. Let's see:

CURSOR_SHARING=FORCE IN 11G WITHOUT HISTOGRAM

Parent  
  |        
Child    

-- Flush the shared pool and issue query using the column 
   without histogram on it so that optimizer 
   is not aware of the skew.

SYS>alter system set CURSOR_SHARING='FORCE';
          alter system flush shared_pool;

HR>conn hr/hr
select count(*) from test where id1=1;
select count(*) from test where id1=2;
select count(*) from test where id1=3;

-- Note that only one parent cursor is created
   One child cursor has been created (version_count=1)

SYS>col sql_text for a30 word_wrapped
         SELECT SQL_TEXT , SQL_ID, VERSION_COUNT, HASH_VALUE,PLAN_HASH_VALUE
         FROM V$SQLAREA
         WHERE LOWER(SQL_TEXT) LIKE 'select count(*) from test%'
              AND LOWER(SQL_TEXT) NOT LIKE '%HASH%';

SQL_TEXT                       SQL_ID        VERSION_COUNT HASH_VALUE	PLAN_HASH_VALUE
------------------------------ ------------- ------------- ----------	---------------
select count(*) from test      07tpk6bm7j4qm             1 3866661587	3507950989
where id1=:"SYS_B_0"

--Note that 1 child cursor has been created

SYS>col child_number for 99
    SELECT SQL_TEXT, SQL_ID, CHILD_NUMBER CHILD#, HASH_VALUE, 
                   PLAN_HASH_VALUE
     FROM V$SQL
     WHERE LOWER(SQL_TEXT) LIKE 'select count(*) from test%'
          AND LOWER(SQL_TEXT) NOT LIKE '%HASH%';

SQL_TEXT                       SQL_ID            CHILD# HASH_VALUE	PLAN_HASH_VALUE
------------------------------ ------------- ---------- ----------	---------------
select count(*) from test      07tpk6bm7j4qm          0 3866661587	3507950989
where id1=:"SYS_B_0"

CURSOR_SHARING=FORCE IN 11G WITH HISTOGRAM

      Parent
       +
   +---+----+
   |        |
  Child    Child
--Flush the shared pool and issue query using the column 
  with histogram on it so that optimizer is aware of the skew.


SYS> alter system flush shared_pool;

HR>conn hr/hr
select count(*) from test where id2=1;
select count(*) from test where id2=2;
select count(*) from test where id2=3;

-- Note that only one parent cursor is created 
Two child cursors have been created (version_count=2)

SYS>col sql_text for a30 word_wrapped
         SELECT SQL_TEXT , SQL_ID, VERSION_COUNT, HASH_VALUE,PLAN_HASH_VALUE
            FROM V$SQLAREA
          WHERE LOWER(SQL_TEXT) LIKE 'select count(*) from test%'
               AND LOWER(SQL_TEXT) NOT LIKE '%HASH%';

SQL_TEXT                       SQL_ID        VERSION_COUNT HASH_VALUE	PLAN_HASH_VALUE
------------------------------ ------------- ------------- ----------	---------------
select count(*) from test      3tcujqmqnqs8t             2 3981140249	2432738936
where id2=:"SYS_B_0"

-- Note that 2 child cursors have been created and 
   each child has a distinct execution plan (PLAN_HASH_VALUE)

SYS>col child_number for 99
         SELECT SQL_TEXT, SQL_ID, CHILD_NUMBER CHILD#, HASH_VALUE,   
                        PLAN_HASH_VALUE
         FROM V$SQL
        WHERE LOWER(SQL_TEXT) LIKE 'select count(*) from test%'
             AND LOWER(SQL_TEXT) NOT LIKE '%HASH%';

SQL_TEXT                       SQL_ID            CHILD# HASH_VALUE	PLAN_HASH_VALUE
------------------------------ ------------- ---------- ----------	---------------
select count(*) from test      3tcujqmqnqs8t          0 3981140249	2432738936
where id2=:"SYS_B_0"
select count(*) from test      3tcujqmqnqs8t          1 3981140249	1489241381
where id2=:"SYS_B_0"

Observations:-

Hence, setting CURSOR_SHARING=FORCE in 11g will use the same child cursor if execution plan is same for different values of the bind variables which means saving in memory in the shared pool and saving in the time for scanning the hash chains in the library cache . This new feature of 11g is called ADAPTIVE CURSOR SHARING.

Note: The behaviour of CURSOR_SHARING=FORCE in 11g is different from 9i/10g. Earlier, it would peek the value of the bind variable during the first execution and decide on the eexcution plan. On subsequent execution of the same statement with different values of the bind variable, it would reuse the same plan irrespective of the skew in the data.


CURSOR_SHARING=FORCE IN 10G WITH/WITHOUT HISTOGRAM

 Parent  
  |        
 Child    


--Let's demonstrate this by simulating 10g optimizer 
by setting the parameter optimizer_geatures_enable to 10.2.0.0.

SYS> alter system set optimizer_features_enable='10.2.0.3';

--Flush the shared pool and issue query using the column with histogram on
it so that optimizer is aware of the skew.

SYS> alter system flush shared_pool;

HR>conn hr/hr
select count(*) from test where id2=1;
select count(*) from test where id2=2;
select count(*) from test where id2=3;

-- Note that only one parent cursor is created
   Only child cursor has been created (version_count=1)

SYS>col sql_text for a30 word_wrapped
    SELECT SQL_TEXT , SQL_ID, VERSION_COUNT, HASH_VALUE,PLAN_HASH_VALUE
    FROM V$SQLAREA
    WHERE LOWER(SQL_TEXT) LIKE 'select count(*) from test%'
      AND LOWER(SQL_TEXT) NOT LIKE '%HASH%';

SQL_TEXT                       SQL_ID        VERSION_COUNT HASH_VALUE PLAN_HASH_VALUE
------------------------------ ------------- ------------- ---------- ---------------
select count(*) from test      3tcujqmqnqs8t             1 3981140249      2432738936
where id2=:"SYS_B_0"

-- Note that 1 child cursor has been created 
SYS>col child_number for 99
    SELECT SQL_TEXT, SQL_ID, CHILD_NUMBER CHILD#, HASH_VALUE, PLAN_HASH_VALUE
     FROM V$SQL
    WHERE LOWER(SQL_TEXT) LIKE 'select count(*) from test%'
      AND LOWER(SQL_TEXT) NOT LIKE '%HASH%';

SQL_TEXT                       SQL_ID            CHILD# HASH_VALUE PLAN_HASH_VALUE
------------------------------ ------------- ---------- ---------- ---------------
select count(*) from test      3tcujqmqnqs8t          0 3981140249      2432738936
where id2=:"SYS_B_0"

To conclude,

CURSOR_SHARING = EXACT

  • Causes maximum memory usage in library cache as two cursors - one parent and one child cursor are created for each distinct value of the bind variable.
  • Gives best performance as optimizer creates different execution plan for each value of the bind variable.

CURSOR_SHARING = SIMILAR

  • Reduces memory usage in library cache as only one parent cursor is created .
  • If data is not skewed or the optimizer is not aware of the skew, optimizer peeks at the value of the bind variable on the first execution of the statement and that plan is used for all the  values of the bind variable. Thus only one child cursor is created resulting in minimum memory usage by child cursors. In this case performance will be affected if there is skew in the data.
  • If data is skewed and the optimizer is aware of the skew, multiple child cursor are created - one for each distinct value of the bind variable. In this case performance will be the best as optimizer creates different execution plan for each value of the bind variable. But in this case we will have multiple child cursors created for the same execution plan.

CURSOR_SHARING = FORCE IN 10g

  • Causes minimum memory usage in library cache as only one parent cursor and only one child cursor are created .

    - In this case performance will be affected if there is skew in the data.

CURSOR_SHARING = FORCE IN 11g (ADAPTIVE CURSOR SHARING)

Reduces  memory usage in library cache as only one parent cursor and only one child cursor are created .

  • If data is not skewed or the optimizer is not aware of the skew, optimizer peeks at the value of the bind variable on the first execution of the statement and that plan is used for all the  values of the bind variable. Thus only one child cursor is created resulting in minimum memory usage by child cursors. In this case performance will be affected if there is skew in the data. (same scenario as cursor_sharing=similar )
  • If data is skewed and the optimizer is aware of the skew, multiple child cursor are created for different values of the bind variable - one for each distinct execution plan . In this case performance will be the best as optimizer creates different execution plans for different values of the bind variable. But in this case we will have only child cursor created for the same execution plan thereby resulting in optimum memory usage by child cursors.

-Thanks

Geek DBA
Shared Pool: Parent & Child Cursors in Shared Pool

What are PARENT AND CHILD CURSORS IN ORACLE

A cursor is a memory area in library cache allocated to a SQL statement which stores various info about the SQL statement like its text, execution plan, statistics etc.

Each SQL statement has

  • One Parent cursor
  • One or more child cursors

PARENT CURSOR

It stores the sql text of the cursor. When two statements are identical textually, they will share the same parent Cursor.
Dynamic View :- V$SQLAREA: Contains one row for each parent cursor

CHILD CURSOR

Each parent requires at least one child cursor but can have more than one child cursors

The Child Cursor holds other required information, like: the identity of the objects referenced by the SQL Cursor; the names, type and length of the bind variables used..etc.

Child cursor contains

  • Environment
  • Statistics
  • Execution Plan
  • Bind variables
  • Dynamic View:- V$SQL : Contains one row for each child cursor

Continue reading Shared Pool: Parent & Child Cursors in Shared Pool

Oracle RAC: Node evictions & 11gR2 node eviction means restart of cluster stack not reboot of node

Cluster integrity and cluster membership will be governed by occsd (oracle cluster synchronization daemon) monitors the nodes using 2 communication channels:

- Private Interconnect  aka Network Heartbeat
- Voting Disk based communication aka  Disk Heartbeat

Network heartbeat:-

Each node in the cluster is “pinged” every second

  • Nodes must respond in css_misscount time (defaults to 30 secs.)
          – Reducing the css_misscount time is generally not supported
  • Network heartbeat failures will lead to node evictions
  • CSSD-log:
        [date / time] [CSSD][1111902528]
        clssnmPollingThread: node mynodename (5) at 75% heartbeat fatal, removal  in 6.7 sec

Disk Heartbeat:-

Each node in the cluster “pings” (r/w) the Voting Disk(s) every second

  • Nodes must receive a response in (long / short) diskTimeout time
            – IF I/O errors indicate clear accessibility problems  timeout is irrelevant
  • Disk heartbeat failures will lead to node evictions
  • CSSD-log: …
         [CSSD] [1115699552] >TRACE: clssnmReadDskHeartbeat:node(2) is down. rcfg(1) wrtcnt(1) LATS(63436584) Disk lastSeqNo(1)

Now, we know with above possibilities (network, disk heartbeat failures can lead to node eviction, but sometime when the server/occsd/resource request also makes the node get evicted which are extreme cases)

Why nodes should be evicted?

Evicting (fencing) nodes is a preventive measure (it’s a good thing)!

  • Nodes are evicted to prevent consequences of a split brain:
        – Shared data must not be written by independently operating nodes
        – The easiest way to prevent this is to forcibly remove a node from the cluster

How are nodes evicted? – STONITH
Once it is determined that a node needs to be evicted,

  • A “kill request” is sent to the respective node(s)
        – Using all (remaining) communication channels
  • A node (CSSD) is requested to “kill itself” - “STONITH like”
        – “STONITH” foresees that a remote node kills the node to be evicted
    EXAMPLE: Voting Disk Failure
    Voting Disks and heartbeat communication is used to determine the node

  • In a 2 node cluster, the node with the lowest node number should survive
  • In a n-node cluster, the biggest sub-cluster should survive (votes based)

EXAMPLE: Network heartbeat failure

  • The network heartbeat between nodes has failed
          – It is determined which nodes can still talk to each other
          – A “kill request” is sent to the node(s) to be evicted
  • Using all (remaining) communication channels  Voting Disk(s)
  • A node is requested to “kill itself”; executer: typically CSSD

EXAMPLE: What if CSSD is stuck or server itself is not responding?

A node is requested to “kill itself”

  • BUT CSSD is “stuck” or “sick” (does not execute) – e.g.:
  •           – CSSD failed for some reason
             – CSSD is not scheduled within a certain margin

    OCSSDMONITOR (was: oprocd) will take over and execute

EXAMPLE: Cluster member (rac instance) can request a to kill another member (RAC Instance)

A cluster member (rac instance ) can request a kill another member in order to protect the data integrity, in such cases like control file progress record not written proper by the failure instance(read here) , then occsd tries to kill that member, if not possible its tries to evict the node.


11gR2 Changes –> Important, in 11GR2, the fencing (eviction) does not to reboot.

  • Until Oracle Clusterware 11.2.0.2, fencing (eviction) meant “re-boot”
  • With Oracle Clusterware 11.2.0.2, re-boots will be seen less, because:
         – Re-boots affect applications that might run an a node, but are not protected
         – Customer requirement: prevent a reboot, just stop the cluster – implemented...

How does this works?

With Oracle Clusterware 11.2.0.2, re-boots will be seen less: Instead of fast re-booting the node, a graceful shutdown of the cluster stack is attempted


  • It starts with a failure – e.g. network heartbeat or interconnect failure
  • Then IO issuing processes are killed; it is made sure that no IO process remains
         – For a RAC DB mainly the log writer and the database writer are of concern
  • Once all IO issuing processes are killed, remaining processes are stopped
         – IF the check for a successful kill of the IO processes, fails → reboot
  • Once all remaining processes are stopped, the stack stops itself with a “restart flag”
  • OHASD will finally attempt to restart the stack after the graceful shutdown
  •    Exception to above:- 

  • IF the check for a successful kill of the IO processes fails → reboot
  • IF CSSD gets killed during the operation → reboot
  • IF cssdmonitor (oprocd replacement) is not scheduled → reboot
  • IF the stack cannot be shutdown in “short_disk_timeout”-seconds → reboot

11gR2 RAC: Why SCAN & Node Listeners in 11gRAC

Hello,

A long notes (confusing) on listeners in 11gR2 RAC.

You all aware of we have two listeners running in database servers in Grid Infrastructure (Aka RAC) namely scan listeners and node listeners.

How does they work?

The SCAN works by being able to resolve to multiple IP addresses reflecting multiple listeners in the cluster handling public client connections. When a client submits a request, the SCAN listener listening on a SCAN IP address and the SCAN port is contracted on a client’s behalf. Because all services on the cluster are registered with the SCAN listener, the SCAN listener replies with the address of the local listener on the least-loaded node where the service is currently being offered. Finally, the client establishes connection to the service through the listener on the node where service is offered. All of these actions take place transparently to the client without any explicit configuration required in the client.


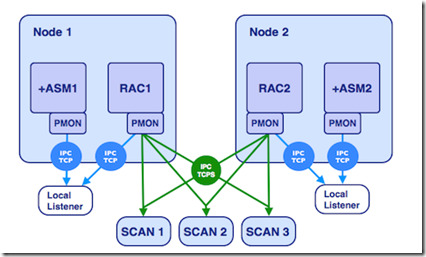
    A picture can save 100 words of explanation

image

    We have 3 scan listeners , registering the IPC(TCP) end points as the RAC instances (remote_listener) registered with PMON of rac instances and the PMON also registers to node listeners (local_listener) which actually points to your database.

  • Indeed they both run from the same home (Grid Home), but for different functionality. From 11gR2 onwards these listeners are part of clusterware and managed by oraagent. This oraagent take care of listeners. This oraagent spawned by crsd takes care of our listeners in terms of configuration and monitoring.
  • Especially when the listener is started by oraagent you can see the lines in the listener.ora file #line added by agent.
  • Another important aspect of the listener.ora files are these files are managed by oraagent, whenever there is a clusterware command is used to manage this listeners. for example srvctl etc.
  • Further, the listeners will be monitored by oraagent process every 60 seconds, which you can find in the  $GRID_HOME/log/nodename}/agent/crsd/oraagent_oracle/oraagent_oracle.log
  • You must set the local_listener and remote_listener parameter to scan listener, description or address list of the same. Since these is the only way now to register your database/instance to scan listener. Even if you dont specify the oraagent will automatically add local_listener values , but you must exclusively set remote_listener parameter to cluster scan name which will provide you the TAF.
    For example,

If you delete the listener.ora and restart the listener with srvctl start listener, a listener.ora will reappear. The original configuration will reappear in listener.ora and the manually modified listener.ora will be renamed (with a timestamp suffix)

  • The agent also creates and maintains the file: endpoints_listener.ora this file is there for backward compatibility,
  • Oraagent comes into action also at instance startup, when the instance is started with srvctl (as opposed to ‘manually’ started instance from sqlplus) and sets LOCAL_LISTENER  parameter, dynamically (this is done with an alter system command and only if the parameter has not been set on spfile).

You may also has observed in listener.ora file there were no tcp/ip settings, Where are the TCP/IP settings of my listeners in listener.ora? and Only IPC endpoints are listed in listener.ora,  As you see below the listener.ora contains only scan listener which contain IPC protocol

Notes:- Before proceed further

What is dynamic listening end point?

dynamic listening endpoint=the address or connection point to the listener. The most known endpoint in the oracle DB world being TCP, port 1521.

Oraagent connects to the listener via IPC and activates the TCP (TCPS, etc) endpoints as specified in the clusterware configuration

Example Listener.ora settings:-

[oracle@rac1]$ cat /u01/app/11.2.0.2/grid/network/admin/listener.ora
LISTENER=(DESCRIPTION=(ADDRESS_LIST=(ADDRESS=(PROTOCOL=IPC)(KEY=LISTENER)))) # line added by Agent
LISTENER_SCAN3=(DESCRIPTION=(ADDRESS_LIST=(ADDRESS=(PROTOCOL=IPC)(KEY=LISTENER_SCAN3)))) # line added by Agent
LISTENER_SCAN2=(DESCRIPTION=(ADDRESS_LIST=(ADDRESS=(PROTOCOL=IPC)(KEY=LISTENER_SCAN2)))) # line added by Agent
LISTENER_SCAN1=(DESCRIPTION=(ADDRESS_LIST=(ADDRESS=(PROTOCOL=IPC)(KEY=LISTENER_SCAN1)))) # line added by Agent
ENABLE_GLOBAL_DYNAMIC_ENDPOINT_LISTENER_SCAN1=ON # line added by Agent
ENABLE_GLOBAL_DYNAMIC_ENDPOINT_LISTENER_SCAN2=ON # line added by Agent
ENABLE_GLOBAL_DYNAMIC_ENDPOINT_LISTENER_SCAN3=ON # line added by Agent
ENABLE_GLOBAL_DYNAMIC_ENDPOINT_LISTENER=ON # line added by Agent
WALLET_LOCATION =
(SOURCE =
(METHOD = FILE)
(METHOD_DATA =
(DIRECTORY = /u01/app/11.2.0.2/grid/network/admin/cost)
)
)

So here no SID, no Port, no host address configured, this is due to the settings whole managed in the clusterware.

SCAN Listeners has an endpoints to the scan listeners in endpoint_listener.ora via IPC or TCP looks like.

endpoints_listener.ora

LISTENER_SCAN3=(DESCRIPTION=(ADDRESS_LIST=(ADDRESS=(PROTOCOL=TCP)(HOST=strac201a-vip)(PORT=1522))(ADDRESS=(PROTOCOL=TCP)(HOST=172.24.21.89)(PORT=1522)(IP=FIRST)))) # line added by Agent
LISTENER_SCAN2=(DESCRIPTION=(ADDRESS_LIST=(ADDRESS=(PROTOCOL=TCP)(HOST=strac201a-vip)(PORT=1521))(ADDRESS=(PROTOCOL=TCP)(HOST=172.24.21.89)(PORT=1521)(IP=FIRST)))) # line added by Agent

tnsnames.ora


MYDB1522 =
(DESCRIPTION =
(ADDRESS = (PROTOCOL = TCP)(HOST = strac201-scan.frxntnyc.frx2.com)(PORT = 1521))
(CONNECT_DATA =
(SERVER = DEDICATED)
(SERVICE_NAME = MYDB1522)
)
)

As you can see the listener.ora files points to IPC scan listeners end points of vip/hostnames in endpoint_listener.ora and once these listeners started , the database pmon registers the sid/services to this listeners (see picture above) as per tnsentries or the local_listener parameter, the pmon register to both node and scan listeners.

For example,

When you just start a listener ,

$GRID_HOME/bin/lsnrctl stop listener; $GRID_HOME/bin/lsnrctl start listener;

This command starts only IPC endpoint

However oraagent is posted at listener startup and makes active the rest of the endpoints (notably listening on the TCP port), this can be seen for example by running the following a few seconds after listener restart: $GRID_HOME/bin/lsnrctl status listener (which will list all the active endpoints), the active endpoints are infact the database instances. This is possible due to the listener.ora parameter you usually see ENABLE_GLOBAL_DYNAMIC_ENDPOINT_{LISTENER_NAME}=ON

Another check,

when you disable the ENABLE_GLOBAL_DYNAMIC_ENDPOINT_LISTENER=OFF in listener.ora

and manually stop the listener (manually means not using srvctl)

$GRID_HOME/bin/lsnrctl stop listener

$GRID_HOME/bin/lsnrctl start listener

When you check listener.ora and check that the parameter edited above has not changed, that is  in this case the TCP endpoint will not be started, that is the listener will be listening only on IPC.

Check with: $GRID_HOME/bin/lsnrctl status listener

If we try do the same exercise by stopping and starting the listener with srvctl, as it would be the typical way to do it, we will see that the parameter ENABLE_GLOBAL_DYNAMIC_ENDPOINT_LISTENER in listener.ora will be set again to ON.

Now, morale of the post,

Always, use srvctl to add listeners,stop,start

And Always, Use srvctl to start instances/db as it set the local_listeners parameter automatically to endpoints.

So that the listener.ora file manages promptly/neatly by oraagent process.

-Thanks

Geek DBA

Thank you! Merry Christmas & Happy New Year

Hello All,

My best wishes for Christmas and upcoming new year to you all!

This year has been very promising to me via this blog which earned me a lot of good friends and fellow DBA’s, indeed I have a learnt a lot too via this channel.

I recognized that the journey of this blog just reached,

  • 100 - days
  • 107 - posts
  • 10000 - hits
  • 29 - followers
  • 4 – contributors or whispers (yes they keep on asking what next in your blog)

“Thank you very much for all your support and sharing your knowledge.”

I would like to thanks to the contributors and if they do not mind, am writing about them here.

Kalyan, the first one will be my old goodie friend,  and our friendship has just completed 17 years, he is working as a SQL DBA for a product based company in Hyderabad and has his own blog Microsoft SQL Server, which I found something very interesting always. Thanks to him to whisper me always to start something on my own like this blog and here we are.

Naga Satish, is the other person who encouraged me always and to do something better and he discusses and shares his extensive knowledge to all of us via this blog. He had 9 years of experience in Oracle DBA and working for major banking giant.

Karishma, another enthusiastic contributor, who is working in US for a product based company and she is busy with golden gate these days. She shares the golden gate issues or relative information regularly and her knowledge share is certainly helpful to me to understand more about golden gate and infact I have to write up some of her shares.

Sarma, new buddy to this team and good going, who is working in Bangalore for a service based company and experienced in Oracle. He shown interest in contributing to this blog and sharing his write up’s which I will publish soon.

Many Thanks to all above and if anyone of you are interested in writing up and want to  help other fellow DBA’s , certainly please you can send me a mail or topic of yours or ask me for an login to write on your own. I hope the above list will become big list soon 🙂

I request you all to share your suggestions to make this blog more helpful to our colleagues,friends or new buddies to DBA field.

All the best to you, next year would be a challenging one for us as 12c database may release soon and makes us again busy in learning’s and migration’s, testing’s etc.

Keep going !!!!!

-Thanks

Geek DBA

Measuring interconnect Traffic

You can find Cluster interconnect traffic from 11gR1 using dba_hist_ic_client_stats

This view has a column called name which gives you the ability to measure three different types of interconnect traffic.

•ipq - Parallel query communications
•dlm - Database lock management
•cache - Global cache communications

break on snap_id skip 1
compute sum of DIFF_RECEIVED_MB on SNAP_ID
compute sum of DIFF_SENT_MB on SNAP_ID
 
select *
from   (select   snap_id,
                 instance_number,
                 round ((bytes_sent - lag (bytes_sent, 1) over
                   (order by instance_number, snap_id)) / 1024 / 1024) diff_sent_mb,
                 round ((bytes_received - lag (bytes_received, 1) over
                   (order by instance_number, snap_id)) / 1024 / 1024) diff_received_mb
        from     dba_hist_ic_client_stats
        where    name = 'ipq' and
                 snap_id between 910 and 917
        order by snap_id,
                 instance_number)
where  snap_id in (911, 913, 915, 917) and
       diff_received_mb &gt;= 10
/
 
SNAP_ID    INSTANCE_NUMBER DIFF_SENT_MB DIFF_RECEIVED_MB
---------- --------------- ------------ ----------------
       913               1        11604            10688
                         2        10690            11584
**********                 ------------ ----------------
sum                               22294            22272
 
       915               1         8353             8350
                         2         8133             8418
                         3         8396             8336
                         4         8514             8299
**********                 ------------ ----------------
sum                               33396            33403
 
       917               1         5033             4853
                         2         4758             4888
                         3         4956             4863
                         4         5029             4852
                         5         4892             4871
                         6         4745             4890
                         7         4753             4889
                         8         4821             4881
**********                 ------------ ----------------
sum                               38987            38987

The script is downloaded from the Greg Rahn blog to show you the output which is readily available and written nicely.

Hope this helps

Row lock: How to find a row that is locked in Oracle

Here is the nice script for finding the row lock (hoping you will find the locked objects easily)

select	do.object_name
,	row_wait_obj#
,	row_wait_file#
,	row_wait_block#
,	row_wait_row#
,	dbms_rowid.rowid_create (1, ROW_WAIT_OBJ#, ROW_WAIT_FILE#, 
				ROW_WAIT_BLOCK#, ROW_WAIT_ROW#)
from	v$session s
,	dba_objects do
where	sid=&sid
and s.ROW_WAIT_OBJ# = o.OBJECT_ID ;

select * from tablename where rowid='';

Notes on ROW_WAIT_* columns in v$session,
ROW_WAIT_OBJ#
NUMBER
Object ID for the table containing the ROWID specified in ROW_WAIT_ROW#

ROW_WAIT_FILE#
NUMBER
Identifier for the datafile containing the ROWID specified in ROW_WAIT_ROW#. This column is valid only if the session is currently waiting for another transaction to commit and the value of ROW_WAIT_OBJ# is not -1.

ROW_WAIT_BLOCK#
NUMBER
Identifier for the block containing the ROWID specified in ROW_WAIT_ROW#. This column is valid only if the session is currently waiting for another transaction to commit and the value of ROW_WAIT_OBJ# is not -1.

ROW_WAIT_ROW#
NUMBER
The current ROWID being locked. This column is valid only if the session is currently waiting for another transaction to commit and the value of ROW_WAIT_OBJ# is not -1.

-Thanks
Geek DBA

UNDO: How does Oracle picks up undo

When transactions hit the database. Each transaction will be allocated one UNDO segment. The transaction will look for extents in the UNDO segment to place UNDO data. It will pick up segments as follows -

(1) Pick up an UNDO segment, which has no ACTIVE extent, if none allocate a new segment. If space does not permit new segment creation, return ERROR.

(2) If the UNDO Segment picked up has got autoextend on

(3) Depending on UNDO requirement, try to extend the UNDO segment to create new extents and use them. If it does not have enough space,

(4) Look for EXPIRED extents (which are over and above the initial extents) in other segments attach them to current segment, if none,

(5) Use the UNEXPIRED extents (which are over and above the initial extents) from other segments. Transaction cannot reuse UNEXPIRED extents in its own segment even if it belongs to other transactions.

An UNDO segment is picked in arbitrary way. Oracle does not pre calculate the amount of UNDO. So a very large transaction may not reuse a very large UNDO Segment. It will arbitrarily pick existing small UNDO segment, try to extend it if datafile permits. If datafile does not permit then it will truncate the other big segment and then reuse extents from them. So it is advisable to have AUTEXTEND OFF or have a suitable MAXSIZE in UNDO datafiles.

UNDO Basics:- (as one of my friend asked this today, thought of post here, since we tend to forget the oldies)

Continue reading UNDO: How does Oracle picks up undo

Script: Object or Table Growth from AWR

Hello All,

Sometimes we were been asked to provide the object or a table growth, Here is some nice script, which is useful to find the table growth per day for a given table;

select   obj.owner, obj.object_name,
           to_char(sn.BEGIN_INTERVAL_TIME,'RRRR-MON-DD') start_day,
           sum(a.db_block_changes_delta) block_increase
  from     dba_hist_seg_stat a,
           dba_hist_snapshot sn,
           dba_objects obj
  where    sn.snap_id = a.snap_id
  and      obj.object_id = a.obj#
  and      obj.owner not in ('SYS','SYSTEM')
  and        obj.object_name='TEST_HIST'
  and      end_interval_time between to_timestamp('01-JAN-2012','DD-MON-RRRR')
           and to_timestamp('29-NOV-2012','DD-MON-RRRR')
  group by obj.owner, obj.object_name,
           to_char(sn.BEGIN_INTERVAL_TIME,'RRRR-MON-DD')
  order by obj.owner, obj.object_name
  /


OWNER            OBJECT_NAME        START_DAY   BLOCK_INCREASE
---------------- -------------  -----------     --------------
TEST             TEST_HIST      2012-NOV-22          18704
TEST             TEST_HIST      2012-NOV-23           9968
TEST             TEST_HIST      2012-NOV-26          10688
TEST             TEST_HIST      2012-NOV-27          10064
TEST             TEST_HIST      2012-NOV-28          10336
SQL> SQL>

The output shows the number of blocks that increased per day, you can calculate blocks & db_block_size and get the exact size if required.

Update: Another method as updated latest by Laurent in his blog post at http://laurentschneider.com/wordpress/2012/12/how-big-was-my-table-yesterday.html

SELECT savtime,owner,object_name,rowcnt,blkcnt
FROM sys.WRI$_OPTSTAT_TAB_HISTORY w,
  dba_objects o
WHERE 
   o.owner='SCOTT'
   AND o.object_name='EMP'
   and o.object_id = W.OBJ#
ORDER BY o.owner, o.object_name, w.savtime;

 
SAVTIME           OWNER    OBJECT_NAME     ROWCNT     BLKCNT
----------------- -------- ----------- ---------- ----------
2012-11-06 06:49  SCOTT    EMP           13215425     120077
2012-11-13 07:28  SCOTT    EMP           12678535     120077
2012-11-20 03:15  SCOTT    EMP           12860640     120077
2012-11-27 03:19  SCOTT    EMP           13045850     120077
2012-12-04 05:41  SCOTT    EMP           13326460     120077

You can find other useful growth trend scripts here in this post:- http://db.geeksinsight.com/2012/10/15/scripts-databasetabletablespace-growth-report-using-awr/

-Hope this helps
Thanks
Geek DBA

Oracle Licensing References

Perhaps, you are also one of like me, difficult to understand about Oracle Licensing strategy with respect to CPU and Cores.

You will need to know about two types for a processor based licensing,

1) Is your host/server is non-virtual based
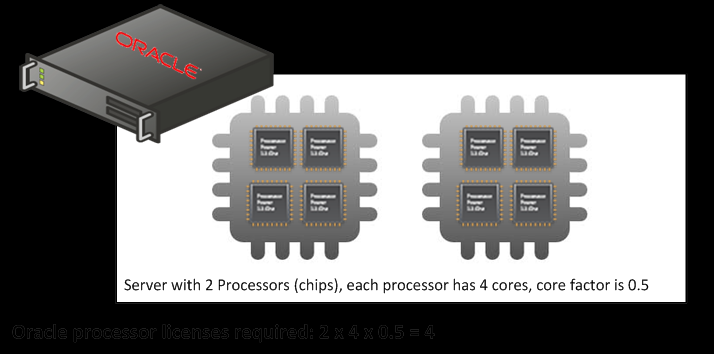
The Processor license for the Oracle Enterprise Edition is based on the number of physical cores in the processors installed in the device. The number of licenses required for a physical server is the number of cores multiplied by a factor tied to the processor type. Oracle publishes a core factor table here that is maintained over time. For instance, a server with 2 Intel Xeon E5620 processors, each of them having 4 cores will require (8 cores) * (.50 core factor) = 4 licenses.

Oracle_License

2) Is your host/server based on Virtual servers

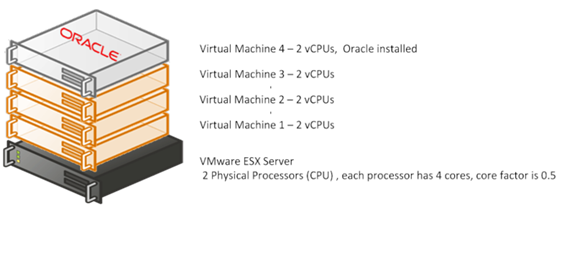
Two major types of partitioning technologies have been identified by Oracle: hard partitioning that physically segments a server such as Solaris Containers, vPar, nPar, etc. Each partition acts as a physically independent, self-contained server with physical resources (CPU, memory…) allocated exclusively to it. Oracle only requires purchasing licenses for the hard partitions where an Oracle database is installed and/or running: only processors allocated to these partitions will be considered in the license calculation. The list of the supported hard partitioning technologies is published by Oracle here. Soft partitioning is a technology where an operating system limits the number of resources allocated to each partition. Solutions such as AIX Workload Manager, Microsoft Hyper-V or VMware ESX belong to that category and are not recognized by Oracle for licensing purposes. Installing an Oracle instance on a single virtual machine in these environments requires licensing all physical processor-cores on the host supporting it.

Oracle_VM_License

In the example shown above, if the virtual machines are hard partitions, the number of Oracle processor licenses required would be: 2 (virtual cores) x 0.5 = 1

If the virtual machines are soft partitions (e.g. VMware ESX), the number of Oracle processor licenses required would be: 2 (processors) x 4 (cores/processor) x 0.5 (Core factor) = 4

-Thanks
Hope this helps.