Hello,
This is the third post in this series, If you haven't read the previous articles please go through here,
Starting 10g, Apart from Metrics tables, there is another area of troubleshooting can be done by using Time Model series. Its very useful to understand where is the over all time in the database that is spending using following tables.
Download For Current Using v$sys_time_model : Current_time_model.sql
Download From AWR using dba_hist_sys_time_model: awr_time_model.sql
Download From Statspack using stats$sys_time_model and stats$sys_time_model_name : statspack_time_model.sql
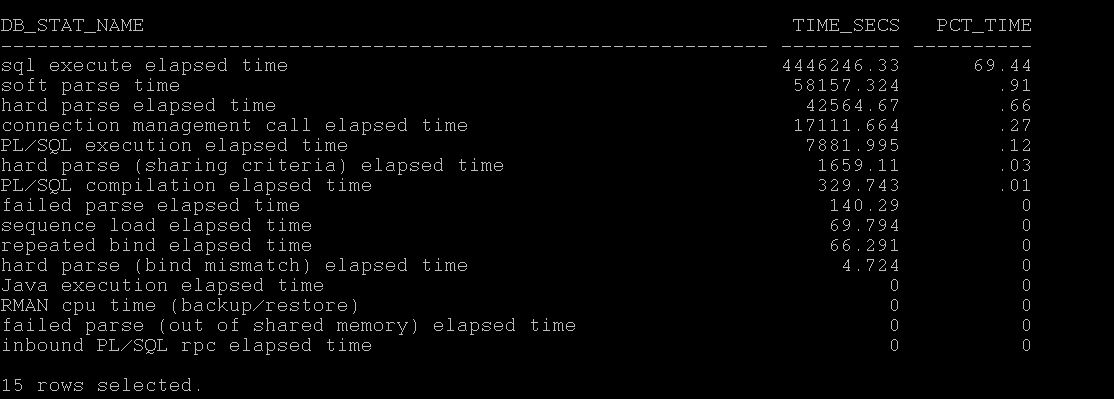
Example Report:-
As you see above, the database in the question takes 69% of total time spent in executing SQL.
If you see, CPU or DB CPU that means Database has spent most of the time in processing on CPU.
If you see, hard parse elapsed time, then it means , most of the spending in hard parses.
If you see, RMAN spending on CPU in large percentages
If you see, Connection management call elapsed time, you may worth checking the no. of connection, network latencies etc.
So in this way you can understand with time model series where the most of the database time is spending.
The following action would be checking which statements are running long, doing lot of parses, or CPU related statements etc. (Long road ahead to write those)
Next in the Series, Understanding I/O Profile and I/O Latencies.
-Thanks
Geek DBA

Follow Me!!!