Subscribe to Posts by Email

Subscriber Count

    703

Disclaimer

All information is offered in good faith and in the hope that it may be of use for educational purpose and for Database community purpose, but is not guaranteed to be correct, up to date or suitable for any particular purpose. db.geeksinsight.com accepts no liability in respect of this information or its use. This site is independent of and does not represent Oracle Corporation in any way. Oracle does not officially sponsor, approve, or endorse this site or its content and if notify any such I am happy to remove. Product and company names mentioned in this website may be the trademarks of their respective owners and published here for informational purpose only. This is my personal blog. The views expressed on these pages are mine and learnt from other blogs and bloggers and to enhance and support the DBA community and this web blog does not represent the thoughts, intentions, plans or strategies of my current employer nor the Oracle and its affiliates or any other companies. And this website does not offer or take profit for providing these content and this is purely non-profit and for educational purpose only. If you see any issues with Content and copy write issues, I am happy to remove if you notify me. Contact Geek DBA Team, via geeksinsights@gmail.com

Pages

RAC: Client & Server connection Load balancing in Oracle

Connection Workload management is one of the key aspects when you have RAC instances as you want to distribute the connections to specific nodes/instance or those have less load.

Oracle from 10g onwards (9i as well) has two features to provide the connection load balancing

Client Side load balancing (also called as connect time load balancing)

Server side load balancing (also called as Listener connection load balancing)

Continue reading RAC: Client & Server connection Load balancing in Oracle

Quick Question #14: Why do we have Virtual IP in Oracle RAC

Why do we have a Virtual IP (VIP) in Oracle RAC 10g or 11g? Why does it just return a dead connection when its primary node fails?

The goal is application availability with the shortest disruption time possible.

When a node fails, the VIP associated with it is automatically failed over to some other node. When this occurs, the following things happen. Vip resources in CRS (ora.node.vip)

(1) VIP detects public network failure which generates a FAN event.  ( A FAN event is an fast application notification event and ONS captures and publishes to the subscriber in RAC the subscriber can be listener)

(2) the new node re-arps (see arpa)  the world indicating a new MAC address for the IP.

(3) connected clients subscribing to FAN immediately receive ORA-3113 error or equivalent. Those not subscribing to FAN will eventually time out.

(4) New connection requests rapidly traverse the tnsnames.ora address list skipping over the dead nodes, instead of having to wait on TCP-IP timeouts (default 10 mins)

Without using VIPs or FAN, clients connected to a node that died will often wait for a TCP timeout period (which can be up to 10 min) before getting an error. As a result, you don't really have a good HA solution without using VIPs and FAN. The easiest way to use FAN is to use an integrated client with Fast Connection Failover (FCF) such as JDBC, OCI, or ODP.NET.

Lib32 folder missing in Oracle 11g Home

One of my colleague struggling from two days for a Oracle client 11g 64 bit installation, where he is expecting a lib32 folder in Oracle_HOME as usual but he didn’t.  Thanks to him first for sharing before to proceed further.

He didn’t succeeded to get lib32 folder instead he found this note, which may save your time too.

So What’s the Oracle’s Answer is about missing Lib32 folder in Oracle home, According to Note:- 883702.1.

$ORACLE_HOME/lib32 does not exist in Oracle database 11gR2. Why? [ID 883702.1]

This is expected behavior  :(. DBA’s do not expect this unless until we hit.

Starting from Oracle database 11gR2, 32-bit libraries are not being shipped with the 64-bit Oracle database server or 64-bit Oracle database client media. Hence after installing Oracle database 11gR2, you will not find lib32 folder inside $ORACLE_HOME.

Additional reference: Missing Lib32 In 11gR2 Client Software for Solaris [ID 1271236.1]

-Thanks

Geek DBA

Troubleshoot ORA-00020: maximum number of processes exceeded – Systematic way

Situation: Application not able to connect and including sysdba sessions. Complete DB hung due to large number of session spike in very less time.

Error:-ORA-00020: maximum number of processes exceeded

Dependent parameters
sessions = 825
processes = 800

Action taken, We have killed some backups jobs and other local sessions and get a slot of sysdba connectivity at last.

Now troubleshooting, why, who are making this happen ORA-00020: maximum number of processes exceeded

Lets have a look at Resource limit to ensure we reached max utilization (800) of resources sessions/processes

col begin_interval_time format a30
select s.begin_interval_time, rl.current_utilization, rl.max_utilization
from DBA_HIST_RESOURCE_LIMIT rl, dba_hist_snapshot s
where resource_name = 'sessions' and rl.instance_number=1 and
s.snap_id = rl.snap_id and
s.instance_number = rl.instance_number
order by s.snap_id;

BEGIN_INTERVAL_TIME CURRENT_UTILIZATION MAX_UTILIZATION
------------------------------ ------------------- ---------------
22-NOV-12 20.00.26.150 266 422
22-NOV-12 21.00.31.261 255 422
22-NOV-12 22.00.36.407 213 422
22-NOV-12 23.00.43.342 218 422
23-NOV-12 00.00.49.774 248 422
23-NOV-12 01.00.55.275 221 422
23-NOV-12 02.00.02.368 210 422
23-NOV-12 03.00.07.255 250 422
23-NOV-12 04.00.15.639 211 885
23-NOV-12 05.57.30.381 355 885

See above the during 04:00 Am we have hit or spike in the sessions from 211/355 to 885

Lets have a look at process utilization


col begin_interval_time format a30
select s.begin_interval_time, rl.current_utilization, rl.max_utilization
from DBA_HIST_RESOURCE_LIMIT rl, dba_hist_snapshot s
where resource_name = 'processes' and rl.instance_number=1 and
s.snap_id = rl.snap_id and
s.instance_number = rl.instance_number
order by s.snap_id;

22-NOV-12 10.00.57.535 278 384
22-NOV-12 11.00.01.032 282 384
22-NOV-12 12.00.04.620 286 384
22-NOV-12 13.00.07.258 268 384
22-NOV-12 14.00.09.862 276 384
22-NOV-12 15.00.14.034 270 384
22-NOV-12 16.00.16.643 300 384
22-NOV-12 17.00.19.141 237 384
22-NOV-12 18.00.21.584 232 384
22-NOV-12 19.00.23.864 232 384
22-NOV-12 20.00.26.150 254 384
22-NOV-12 21.00.31.261 239 384
22-NOV-12 22.00.36.407 204 384
22-NOV-12 23.00.43.342 205 384
23-NOV-12 00.00.49.774 237 384
23-NOV-12 01.00.55.275 207 384
23-NOV-12 02.00.02.368 203 384
23-NOV-12 03.00.07.255 237 384
23-NOV-12 04.00.15.639 199 800
23-NOV-12 05.57.30.381 335 800

Let check the sysstat has an entries about it, nopes it does not listed the maximum utilization as it missed to collected the stats.

select to_char(begin_interval_time, 'mm-dd-yy hh24:mi'),
sum(value) value
from DBA_HIST_SYSSTAT s, dba_hist_snapshot h
where s.snap_id=h.snap_id
and s.instance_number=h.instance_number
and STAT_NAME like '%logons current%'
and begin_interval_time > sysdate - 30
group by to_char( begin_interval_time,'mm-dd-yy hh24:mi')
order by 1;

TO_CHAR(BEGIN_ VALUE
-------------- ----------
11-15-12 23:00 135
11-16-12 00:00 122
11-16-12 01:00 129
11-16-12 02:00 187
11-16-12 03:00 144
11-16-12 04:00 193
11-16-12 05:00 236
11-16-12 06:00 169
11-16-12 07:00 258
11-16-12 08:00 270
...
...
...
11-23-12 02:00 202
11-23-12 03:00 236
11-23-12 04:00 198
11-23-12 05:57 334
11-23-12 05:57 334
175 rows selected.
SQL>

Q1 Logon currents showing 334 only, why it is not showing?

Another area of interest to troubleshoot, dba_hist_sysmetric_summary gives you the hourly metrics of the statistics, we have to metrics that collected in database called Session Limit % and Process Limit % ,

SQL> select begin_time,metric_name,minval,maxval from DBA_HIST_SYSMETRIC_SUMMARY where metric_name='Session Limit %' order by begin_time;

22-NOV-12 Session Limit % 0 42.0338983
22-NOV-12 Session Limit % 0 30.2824859
22-NOV-12 Session Limit % 0 28.9265537
22-NOV-12 Session Limit % 0 25.6497175
23-NOV-12 Session Limit % 0 27.6836158
23-NOV-12 Session Limit % 0 28.8135593
23-NOV-12 Session Limit % 0 27.4576271
23-NOV-12 Session Limit % 0 40.6779661
23-NOV-12 Session Limit % 0 97.0621469 ---> Increase
23-NOV-12 Session Limit % 0 45.4237288
23-NOV-12 Session Limit % 0 39.0960452

SQL> select begin_time,metric_name,minval,maxval from DBA_HIST_SYSMETRIC_SUMMARY where metric_name='Process Limit %' order by begin_time;

22-NOV-12 Process Limit % 0 27.25
23-NOV-12 Process Limit % 0 29.5
23-NOV-12 Process Limit % 0 30.75
23-NOV-12 Process Limit % 0 29.125
23-NOV-12 Process Limit % 0 41.625
23-NOV-12 Process Limit % 0 99.875 --> Increase
23-NOV-12 Process Limit % 0 45.875
23-NOV-12 Process Limit % 0 41.25

You see above there was a sudden jump in the session and process limit % increase from 49% to 99% , so we determined now there are some obvious/dubios connections happening.

Q2, How to find the which users or machine or terminal has most connections during the period?

If you have audit enabled: use aud$ by filtering the statement column with "%logon%';

Use active session history, but the sample of 10 sec to 1 entry in active session history make the sessions count big large, we have to rollup here something,

I still have to write queries for both of above and publish soon.

Update 21-Feb-2013:-
Few more queries, if you have a Grid Control Enabled and targets created, you can use the below queries.

SQL> select COLLECTION_TIMESTAMP,to_number(value) from sysman.mgmt$metric_details where metric_label = 'User-Defined SQL Metrics' and key_value='CONCURRENT_SESSIONS' and COLLECTION_TIMESTAMP between '19/02/2013 17:30:00' and '19/02/2013 18:30:00' and target_name='' and value is not null order by collection_timestamp;

COLLECTION_TIMESTAM TO_NUMBER(VALUE)
------------------- ----------------
19/02/2013 17:32:50 1965
19/02/2013 17:37:50 1917
19/02/2013 17:42:50 1800
19/02/2013 17:47:50 1758
19/02/2013 17:52:50 1719
19/02/2013 17:57:50 1856
19/02/2013 18:02:50 1937
19/02/2013 18:07:50 1714
19/02/2013 18:12:50 2061
19/02/2013 18:17:50 1737
19/02/2013 18:22:50 1518
19/02/2013 18:27:50 1708

12 rows selected.

SQL> select COLLECTION_TIMESTAMP,to_number(value) from sysman.mgmt$metric_details where metric_label = 'User-Defined SQL Metrics' and key_value='CONCURRENT_SESSIONS_ACTIVE' and COLLECTION_TIMESTAMP between '19/02/2013 17:30:00' and '19/02/2013 18:30:00' and target_name='' and value is not null order by collection_timestamp;

COLLECTION_TIMESTAM TO_NUMBER(VALUE)
------------------- ----------------
19/02/2013 17:32:03 24
19/02/2013 17:37:02 113
19/02/2013 17:42:02 31
19/02/2013 17:47:02 26
19/02/2013 17:52:03 39
19/02/2013 17:57:02 179
19/02/2013 18:02:03 443
19/02/2013 18:07:02 202
19/02/2013 18:12:03 524
19/02/2013 18:17:03 325
19/02/2013 18:22:02 29
19/02/2013 18:27:02 31

-Thanks
Geek DBA
Explain Plan: Different formats/options with dbms_xplan

The DBMS_XPLAN package provides an easy way to display the output of the EXPLAIN PLAN command in several, predefined formats. You can also use the DBMS_XPLAN package to display the plan of a statement stored in the Automatic Workload Repository (AWR) or stored in a SQL tuning set. It further provides a way to display the SQL execution plan and SQL execution runtime statistics for cached SQL cursors based on the information stored in the V$SQL_PLAN and V$SQL_PLAN_STATISTICS_ALL fixed views. Finally, it displays plans from a SQL plan baseline.

So that’s from the documentation, DBMS_XPLAN has other functions as follows:-

  • DISPLAY - to format and display the contents of a plan table.
  • DISPLAY_AWR - to format and display the contents of the execution plan of a stored SQL statement in the AWR.
  • DISPLAY_CURSOR - to format and display the contents of the execution plan of any loaded cursor.
  • DISPLAY_SQL_PLAN_BASELINE - to display one or more execution plans for the SQL statement identified by SQL handle
  • DISPLAY_SQLSET - to format and display the contents of the execution plan of statements stored in a SQL tuning set.

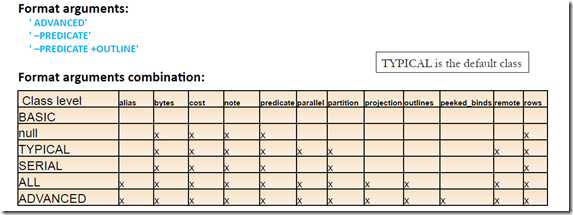
So each of the above sub programs have different options and formats to view your execution plan, First look at the matrix table below before we proceed with examples.

image

Examples:-

Continue reading Explain Plan: Different formats/options with dbms_xplan

Unix: Top 10 useful SAR commands in unix, performance monitoring using SAR

The following are the top 10 Useful SAR commands for DBA’s.

1. CPU Usage of ALL CPUs (sar -u)

This gives the cumulative real-time CPU usage of all CPUs. “1 3″ reports for every 1 seconds a total of 3 times. Most likely you’ll focus on the last field “%idle” to see the cpu load.

$ sar -u 1 3
Linux 2.6.19-194.el5SMP (host)        09/26/2012      _i686_  (8 CPU)

01:27:32 PM       CPU     %user     %nice   %system   %iowait    %steal     %idle
01:27:33 PM       all      0.00      0.00      0.00      0.00      0.00    100.00
01:27:34 PM       all      0.25      0.00      0.25      0.00      0.00     99.50
01:27:35 PM       all      0.75      0.00      0.25      0.00      0.00     99.00
Average:          all      0.33      0.00      0.17      0.00      0.00     99.50

Following are few variations:

  • sar -u Displays CPU usage for the current day that was collected until that point.
  • sar -u 1 3 Displays real time CPU usage every 1 second for 3 times.
  • sar -u ALL Same as “sar -u” but displays additional fields.
  • sar -u ALL 1 3 Same as “sar -u 1 3″ but displays additional fields.

Continue reading Unix: Top 10 useful SAR commands in unix, performance monitoring using SAR

Unix: Performance tools available for you

This is beginning of Unix series post for DBA’s to understand the monitoring tools for Linux

Sysstat is the package that contains various tools or utilities to collect or view the performance of the Unix servers.

Installing sysstat

wget http://pagesperso-orange.fr/sebastien.godard/sysstat-10.0.0.tar.bz2

tar xvfj sysstat-10.0.0.tar.bz2

cd sysstat-10.0.0

./configure --enable-install-cron

make

make install

Verify

$ sar –V

sysstat version 10.0.0 (C) Sebastien Godard (sysstat orange.fr)


Tools or Utilities that are part of Sysstat package


  • sar collects and displays ALL system activities statistics.
  • sadc stands for “system activity data collector”. This is the sar backend tool that does the data collection.
  • sa1 stores system activities in binary data file. sa1 depends on sadc for this purpose. sa1 runs from cron.
  • sa2 creates daily summary of the collected statistics. sa2 runs from cron.
  • sadf can generate sar report in CSV, XML, and various other formats. Use this to integrate sar data with other tools.
  • iostat generates CPU, I/O statistics
  • mpstat displays CPU statistics.
  • pidstat reports statistics based on the process id (PID)
  • nfsiostat displays NFS I/O statistics.
  • cifsiostat generates CIFS statistics.

Next Post: Top 10 Useful commands in SAR

-Thanks

Geek DBA

11g Compare statistics

Compare statistics, good idea, Ok, here is the scenario

You have a large table where you have collected the statistics with sample of 10%, and due to some reasons you want to collect the statistics with auto or 100% sample size, but you are unsure of the difference it make. Note its not about to restoring the old statistics, but its about to compare the statistics changes over the period.

Oracle 11g (R1) comes up with three new procedures in dbms_stats package.

  • DBMS_STAT.DIFF_TABLE_STATS_IN_HISTORY (opt stats history)
  • DBMS_STAT.DIFF_TABLE_STATS_IN_PENDING (pending stats)
  • DBMS_STAT.DIFF_TABLE_STATS_IN_STATTAB (statistics table , backup of your statistics)

    The DIFF_TABLE_STATS_* statistics can be used to compare statistics for a table from two different sources. The statistics can be from:

  • two different user statistics tables

    a single user statistics table containing two sets of statistics that can be identified using statids

    a user statistics table and dictionary history

    pending statistics

      The functions also compare the statistics of the dependent objects (indexes, columns, partitions). They displays statistics of the object(s) from both sources if the difference between those statistics exceeds a certain threshold (%). The threshold can be specified as an argument to the function, with a default of 10%. The statistics corresponding to the first source (stattab1 or time1) will be used as basis for computing the differential percentage.
  • For example,

    Continue reading 11g Compare statistics

  • RAC Performance: DFS Lock Handle + Row Cache Lock + ENQ: SQ Contention , hanged the rac instance.

    Symptoms:

    Alert log says WAITED TOO LONG FOR A ROW CACHE ENQUEUE LOCK!

    Wait events in Node A: DFS Lock Handle and hanged

    Wait events in Node B: row cache locks and library cache locks (sessions permitted but very slow)

    AWR reports says for the interesting period: DFS Lock Handle

    Background:- DFS Lock Handle

    DFS stands for distributed file system is an ancient name, associated with cluster file system operations, in a Lock manager supplied by vendors in Oracle Parallel Server Environment (prior name for RAC). But, this wait event has morphed and is now associated with waits irrelevant to database files also.

    This will occur in RAC environment, possible with sequences especially when you have sequences + cache + Ordered set.

    Means created like this, create sequence s1 min value 1 cache 20 order;

    As RAC is multi instance environment, the values of the sequences need to be synchronized as they are need to be ordered.

    Simulation of the issue:-

    Continue reading RAC Performance: DFS Lock Handle + Row Cache Lock + ENQ: SQ Contention , hanged the rac instance.

    Do not want bind peeking? what you have in then? _optim_peek_user_binds=false vs. /*+ NO_BIND_AWARE */

    Adaptive cursor sharing introduced in 11g R1 to address the bind peeking issues with things track especially the bind aware and bind sensitivity. This is for plan stability right,

    Read here more on this.

    Can this stability when bind peeking issues is be achievable in 10g, well the obvious answer is sql profiles, stored out lines.

    Another option is to disable the bind peeking using the hidden parameter _optim_peek_user_binds=false

    But this may have side affects as you are turning off for entire instance, what if and how you want to disable the bind peeking for only single statement,


    Continue reading Do not want bind peeking? what you have in then? _optim_peek_user_binds=false vs. /*+ NO_BIND_AWARE */