The DBMS_XPLAN package provides an easy way to display the output of the EXPLAIN PLAN command in several, predefined formats. You can also use the DBMS_XPLAN package to display the plan of a statement stored in the Automatic Workload Repository (AWR) or stored in a SQL tuning set. It further provides a way to display the SQL execution plan and SQL execution runtime statistics for cached SQL cursors based on the information stored in the V$SQL_PLAN and V$SQL_PLAN_STATISTICS_ALL fixed views. Finally, it displays plans from a SQL plan baseline.
So that’s from the documentation, DBMS_XPLAN has other functions as follows:-
DISPLAY- to format and display the contents of a plan table.DISPLAY_AWR- to format and display the contents of the execution plan of a stored SQL statement in the AWR.DISPLAY_CURSOR- to format and display the contents of the execution plan of any loaded cursor.DISPLAY_SQL_PLAN_BASELINE- to display one or more execution plans for the SQL statement identified by SQL handleDISPLAY_SQLSET- to format and display the contents of the execution plan of statements stored in a SQL tuning set.
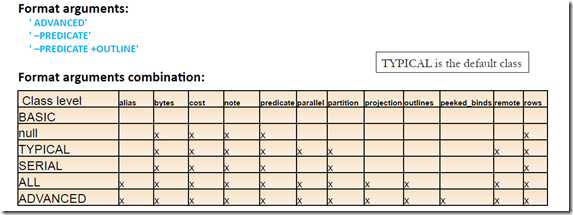
So each of the above sub programs have different options and formats to view your execution plan, First look at the matrix table below before we proceed with examples.
Examples:-
Display
To display the result of the last EXPLAIN PLAN command stored in the plan table:
SELECT * FROM table (DBMS_XPLAN.DISPLAY);
To display from other than the default plan table, "my_plan_table":
SELECT * FROM table (DBMS_XPLAN.DISPLAY('my_plan_table'));
To display the minimum plan information:
SELECT * FROM table (DBMS_XPLAN.DISPLAY('plan_table', null, 'basic'));
To display the plan for a statement identified by 'foo', such as statement_id='foo':
SELECT * FROM table (DBMS_XPLAN.DISPLAY('plan_table', 'foo'));
Cursor
To display the execution plan of the last SQL statement executed by the current session:
SELECT * FROM table (DBMS_XPLAN.DISPLAY_CURSOR);
To display the execution plan of all children associated with the SQL ID 'atfwcg8anrykp':
SELECT * FROM table (DBMS_XPLAN.DISPLAY_CURSOR('atfwcg8anrykp'));
To display runtime statistics for the cursor included in the preceding statement:
SELECT * FROM table (DBMS_XPLAN.DISPLAY_CURSOR('atfwcg8anrykp', NULL, 'ALLSTATS LAST');
SELECT * FROM table ( DBMS_XPLAN.DISPLAY_CURSOR);
To display runtime statistics of a cursor with all sections of execution plan
SELECT * FROM table ( DBMS_XPLAN.DISPLAY_CURSOR('atfwcg8anrykp',, NULL, 'ADVANCED));
AWR
This information will be derived from the dba_hist_sql_plan.
To generate the execution plan for all the plans that stored in awr for given statement
SELECT * FROM table(DBMS_XPLAN.DISPLAY_AWR('atfwcg8anrykp'));
To generate the execution plan but only for single plan_hash_value in awr
SELECT * FROM table(DBMS_XPLAN.DISPLAY_AWR('atfwcg8anrykp', NULL,’12939339393’));
Now you are aware that we have different format/options available with dbms_xplan.display_*****
Proceeding further, You may also need to understand, there different sections produced whilst using each of above. For example, using dbms_xplan.display_cursor subprogram
select * from table(dbms_xplan.display_cursor(‘atfwcg8anrykp’);
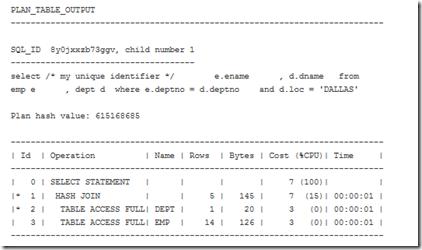
A normal output like below is visible with sections, Plan_table_output and predication_information and a Note section.
PLAN_TABLE_OUTPUT
PREDICATE_INFORMATION
COLUMN_PROJECTION_INFORMATION
NOTE SECTION
- Dynamic sampling used for this statement
But If you add,
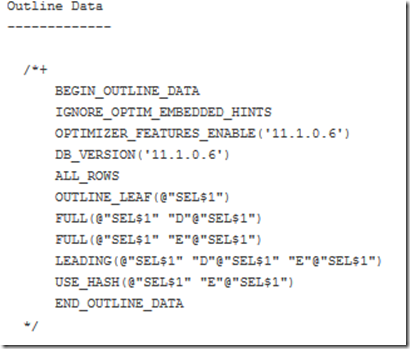
select * from table(dbms_xplan.display_cursor(‘atfwcg8anrykp’, null, ‘OUTLINE LAST’);
This will show the above + outline data which is optimizer execution tree
OUTLINE_DATA
If you further want to know, bind values that are peeked with the statement you can get,
along with above the additional section of bind peeking will be available,
select * from table(dbms_xplan.display_cursor(‘atfwcg8anrykp’, null, ‘OUTLINE + PEEKED_BINDS’);
BIND_PEEKING_INFORMATION:
E.DEPT_NO= 10 (number 10)
All of above can be visible with either “ALL” and “ADVANCED” options
select * from table(dbms_xplan.display_cursor(‘atfwcg8anrykp’, null, ‘ADVANCED’);
Well, this is not enough, Suppose you want the last execution stats that available with this statement in terms of IO and Memory usage.
Use ALLSTATS for both IO and Memory, like below.
select * from table(dbms_xplan.display_cursor(‘atfwcg8anrykp’, null, ‘ALLSTATS LAST’);
The third parameter here provides the last execution with all statistics, IO/Mem
You can use only IOSTATS for IO related stats, MEMSTATS for Memory related execution statistics.
Sample execution Plan
Here you can see the additional columns in the execution plan:-
Starts:- this is the number of times the particular step is executed. Most of the times it is 1, but in case of a nested loop you will likely see a higher number. Note that it shows the actual number of times the operation has been performed. So it only shows up when plan statistics have been gathered by using the /*+ gather_plan_statistics */ hint or by setting the statistics_level parameter to all
E-Rows:-This is the estimated number of rows. Estimated by optimizer during parse phase.
A-Rows:- This is the actual number of rows. This number is taken from the plan_statistics, so it only shows up when plan statistics have been gathered.
A-Time:- Actual time for that statement that is taken for execution of that step.
Buffers:- Consistent reads that performed for that step.
Reads:- Physical reads that performed for this step
PS:- Buffers and Reads are only visible when used IOSTATS or ALLSTATS etc and statistics are gathered on the table or run time using /* +gather_plan_statistics */
OMem:- Estimated optimal mem (PGA) size, to execute the operation in memory.
1Mem:- Estimated size to execute the operation in single pass to disk?
Used-Mem:- Actual memory used by this work area during last execution of cursor.
Ps:- OMem,1Mem, Used_mem were only visible when there is a real operation performing and using memory for sorting etc. In conjunction can be used only with MEMSTATS etc.
Thanks
Geek DBA
Ref: http://docs.oracle.com/cd/E11882_01/appdev.112/e10577/d_xplan.htm


[…] OMem and 1Mem. What is their meaning? I could not find any reference or documentation about them, just this single web page, claiming (or […]