If you are working a production support DBA and very often you will need to check the statistics of the table and how much change what changed in each columns etc. I have figured out two ways for it and seems very useful.
Option 1:- 11gR1 has a package to show differences and comparison of statistics previous date and current date or what given date (30 days retention)
Step 1: set longchunksize 10000 pages 1000 lines 1000 long 100000
Step 2:- select * from table(dbms_stats.diff_table_stats_in_history(
ownname => user,
tabname => upper('&tabname'),
time1 => systimestamp,
time2 => to_timestamp('&time2','yyyy-mm-dd:hh24:mi:ss'),
pctthreshold => 0));
Enter value for tabname: TEST
old 3: tabname => upper('&tabname'),
new 3: tabname => upper('TEST'),
Enter value for time2: 2015-08-20:10:00:00
old 5: time2 => to_timestamp('&time2','yyyy-mm-dd:hh24:mi:ss'),
new 5: time2 => to_timestamp('2015-08-20:10:00:00','yyyy-mm-dd:hh24:mi:ss'),
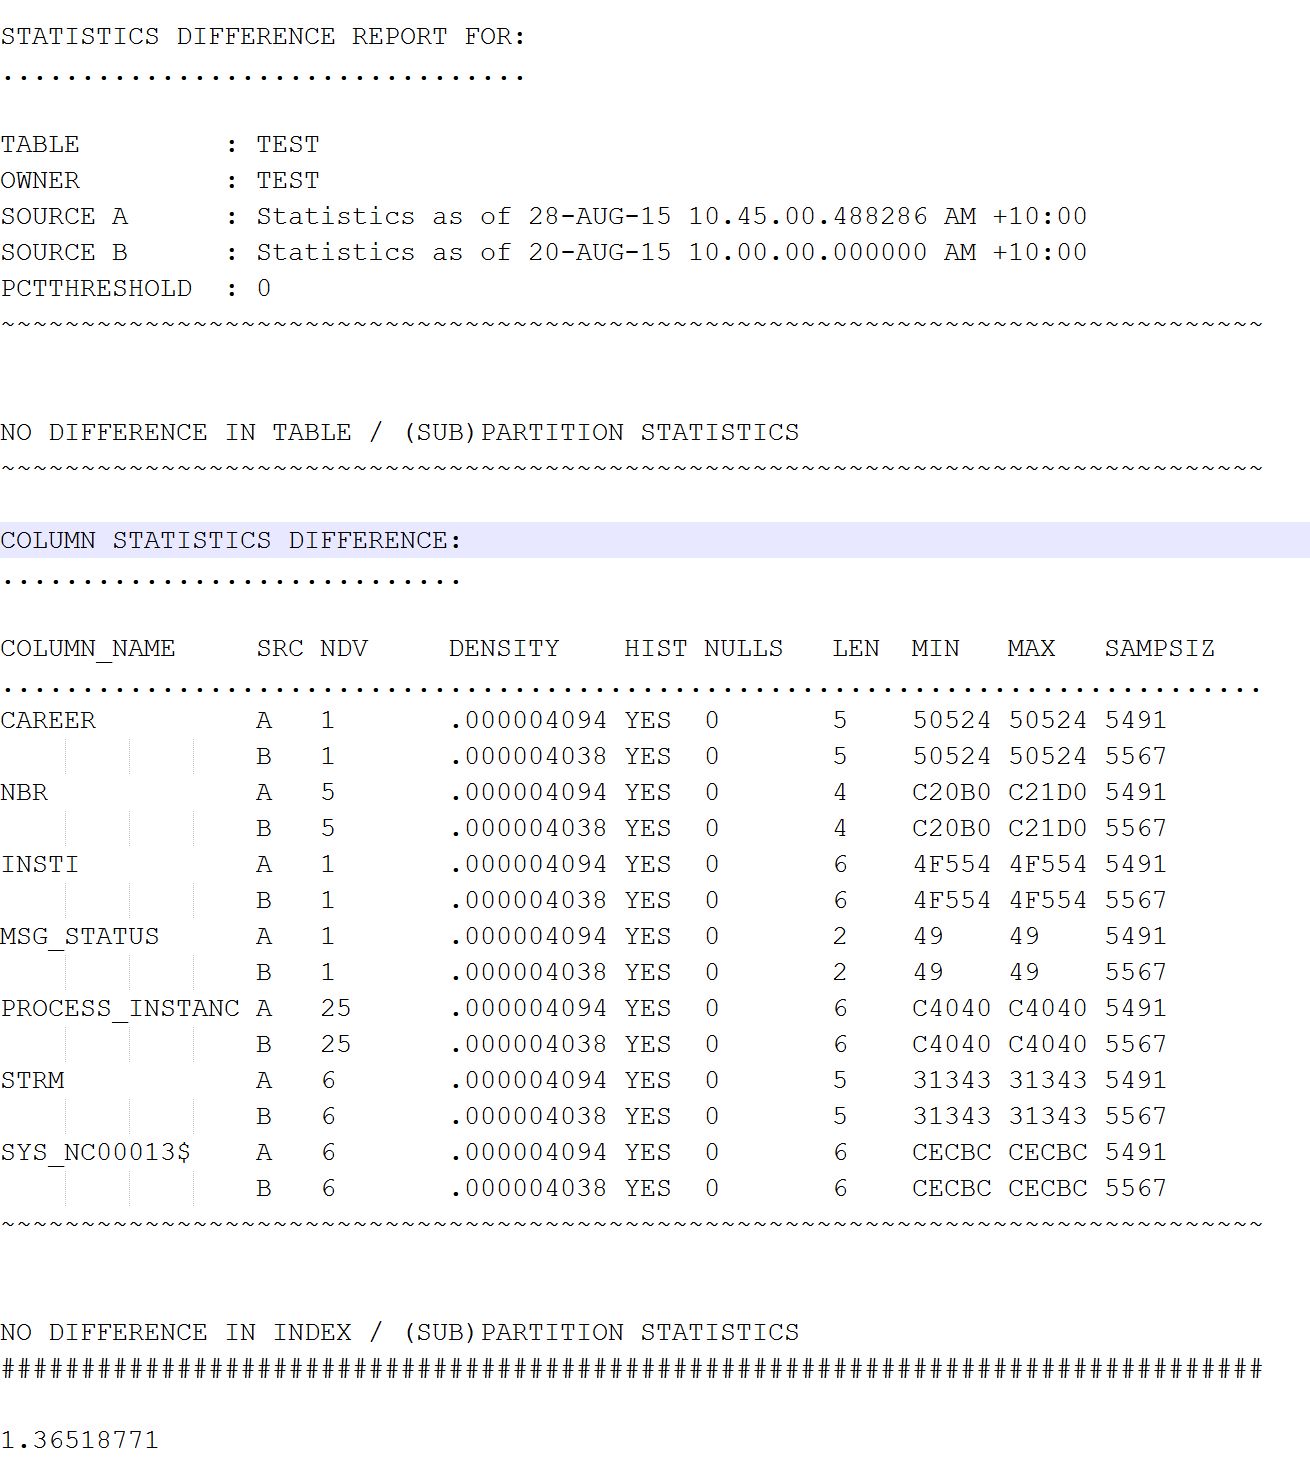
Step 3:- You get an output like below. Nice isn't it? And also gives the ability to understand which column has difference more. A & B tells the A period and B period, Min Max tells the minimum/maximum num of rows
Option:-2 - Just run the plain query to percentage the change of statistics in dba_tab_statistics and dba_tab_modification_history
colu anlyzd_rows form 99999,999,999
colu tot_rows form 99999,999,999
colu tab_name form a45
colu chngs form 99,999,999,999
colu pct_c form 9999999990.99
col truncated head 'Trun|cated' for a5 justify l
select dbta.owner||'.'||dbta.table_name tab_name
, dbta.num_rows anlyzd_rows
, to_char(dbta.last_analyzed,'yyyy-mm-dd hh24:mi:ss') last_anlzd
, nvl(dbta.num_rows,0)+nvl(dtm.inserts,0) -nvl(dtm.deletes,0) tot_rows
, nvl(dtm.inserts,0)+nvl(dtm.deletes,0)+nvl(dtm.updates,0) chngs
,(nvl(dtm.inserts,0)+nvl(dtm.deletes,0)+nvl(dtm.updates,0)) /greatest(nvl(dbta.num_rows,0),1) pct_c
, dtm.truncated
from dba_tab_statistics dbta
left outer join sys.dba_tab_modifications dtm
on dbta.owner = dtm.table_owner
and dbta.table_name = dtm.table_name
and dtm.partition_name is null
where
--and
--dbta.last_analyzed < sysdate - 1
STALE_STATS = 'YES'
and dbta.owner='&owner' order by dbta.last_analyzed desc;
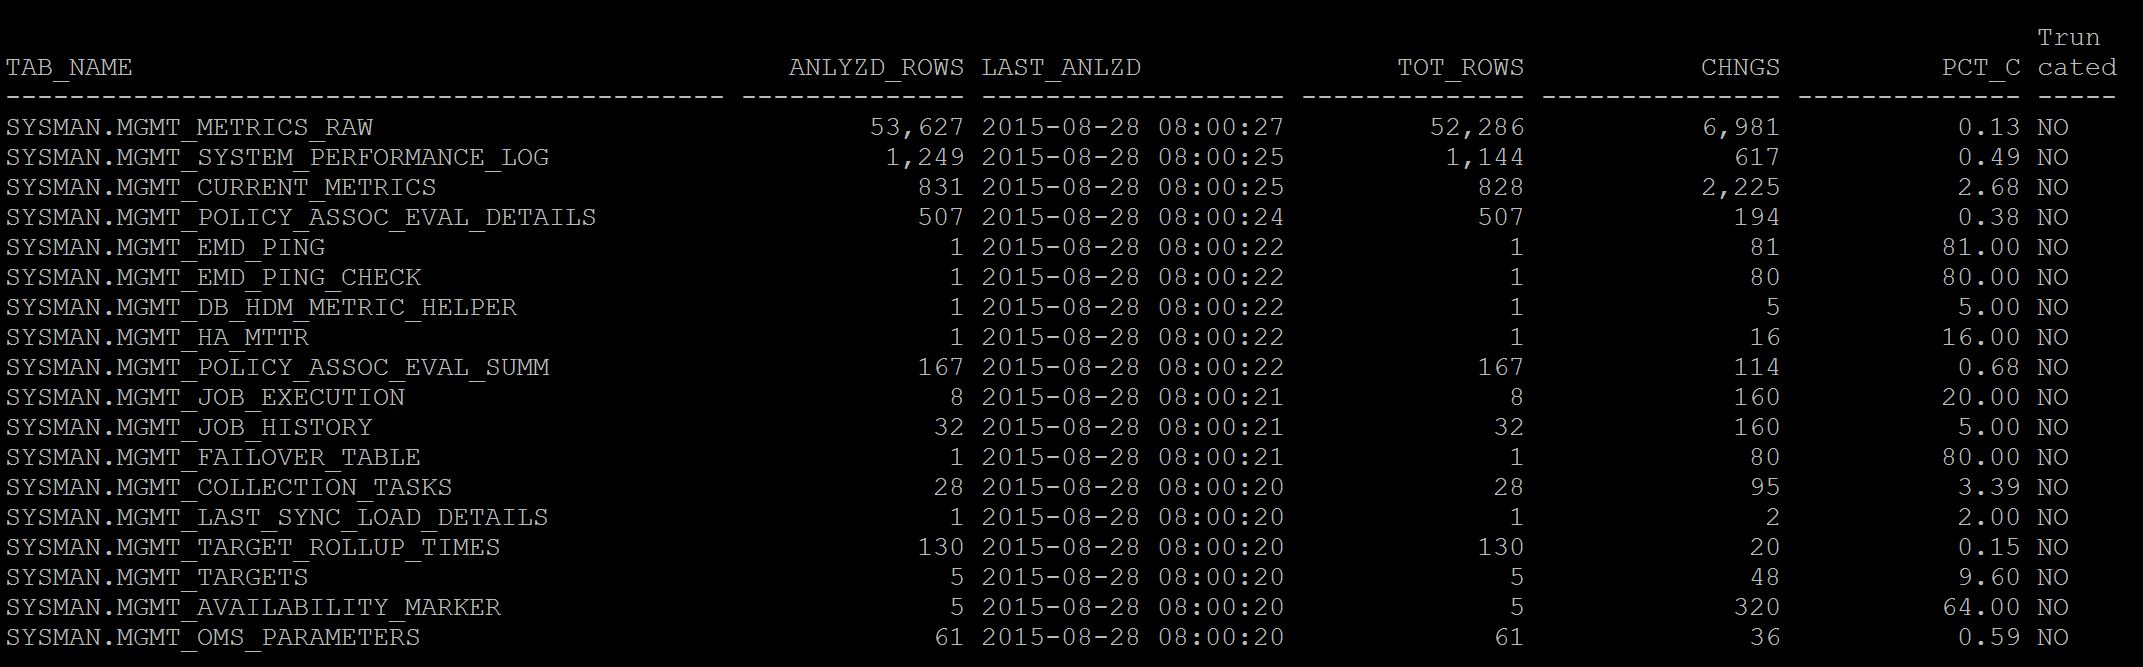
And the output as below. As you see below the percentage change of DML for each table after last stats collection, this helps you to keep additional jobs in place for very much volatile tables.
Geek DBA
Follow Me!!!