Subscribe to Posts by Email

Subscriber Count

    696

Disclaimer

All information is offered in good faith and in the hope that it may be of use for educational purpose and for Database community purpose, but is not guaranteed to be correct, up to date or suitable for any particular purpose. db.geeksinsight.com accepts no liability in respect of this information or its use. This site is independent of and does not represent Oracle Corporation in any way. Oracle does not officially sponsor, approve, or endorse this site or its content and if notify any such I am happy to remove. Product and company names mentioned in this website may be the trademarks of their respective owners and published here for informational purpose only. This is my personal blog. The views expressed on these pages are mine and learnt from other blogs and bloggers and to enhance and support the DBA community and this web blog does not represent the thoughts, intentions, plans or strategies of my current employer nor the Oracle and its affiliates or any other companies. And this website does not offer or take profit for providing these content and this is purely non-profit and for educational purpose only. If you see any issues with Content and copy write issues, I am happy to remove if you notify me. Contact Geek DBA Team, via geeksinsights@gmail.com

Pages

Database Service Availability Summary – Grafana Dashboard

Database landscape become vast and we have seen unprecedented growth and usage of many database technologies in the organizations and no one size fit for all tool is available in the market to monitor all of those databases.

I have started the journey with Prometheus monitoring couple of years back and found its very promising and currently we monitor all of open source databases (as it stand today, MySQL, Postgres, Redis, Neo4j, Cassandra, Mongodb,Elasticsearch). The rich grafana dashboards and the community contribution for exporters is really great

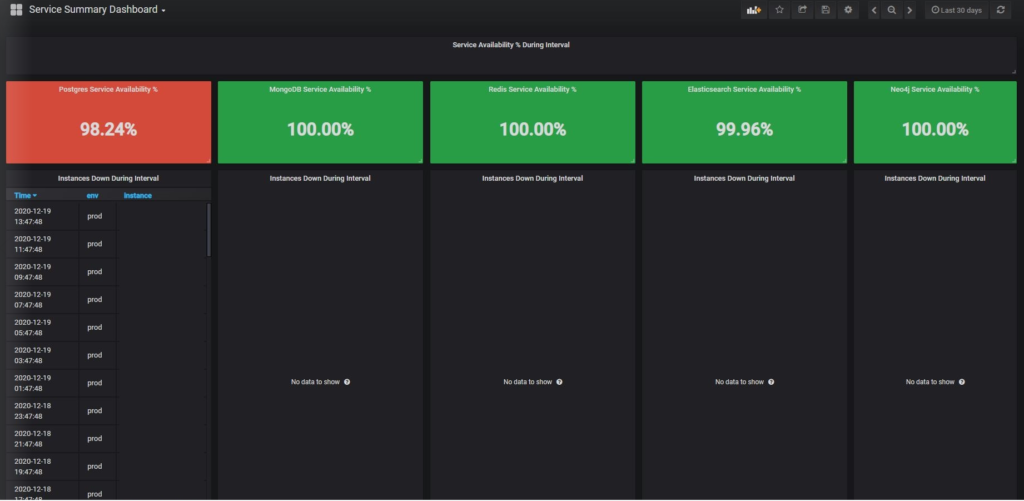
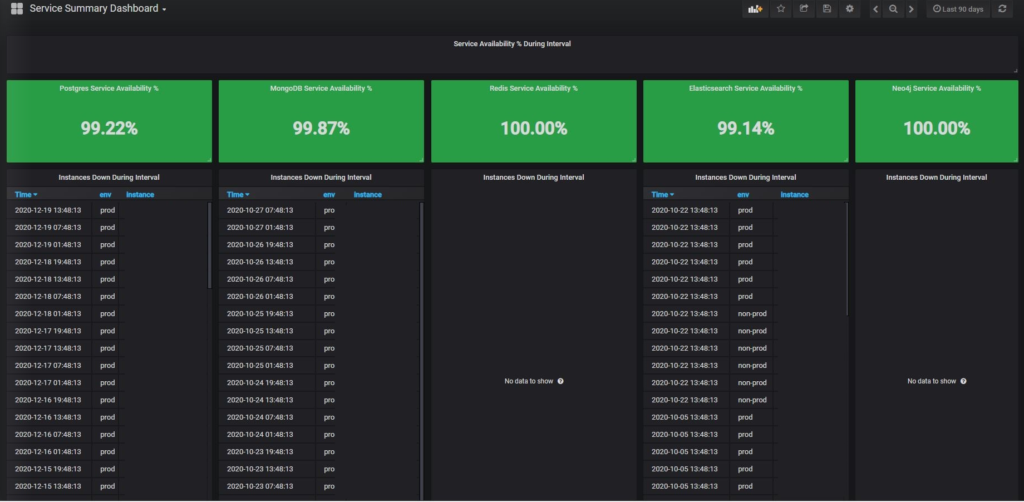
All I did not found is a Service Availability summary of all databases dashboard which tells me the % of database availability during the period which will be a obvious KPI for any Operations team.

I have looked around grafana.com and could not find anything, so started creating my own dashboard and a good learning to me too.

Here are the snippets for the same, which provide summary of service availability of all databases that you are currently tagged to prometheus. All you need to have is the label "tech" and "env" so then all good. The source of the data is "prometheus" you can change once you deploy the dashboard in grafana.

Dashboard json can be downloaded from grafana.com , here

Hope this help to you too.

Comments are closed.